ACME: A Multi-Cultural Multi-Embodiment Social Navigation Dataset










Abstract
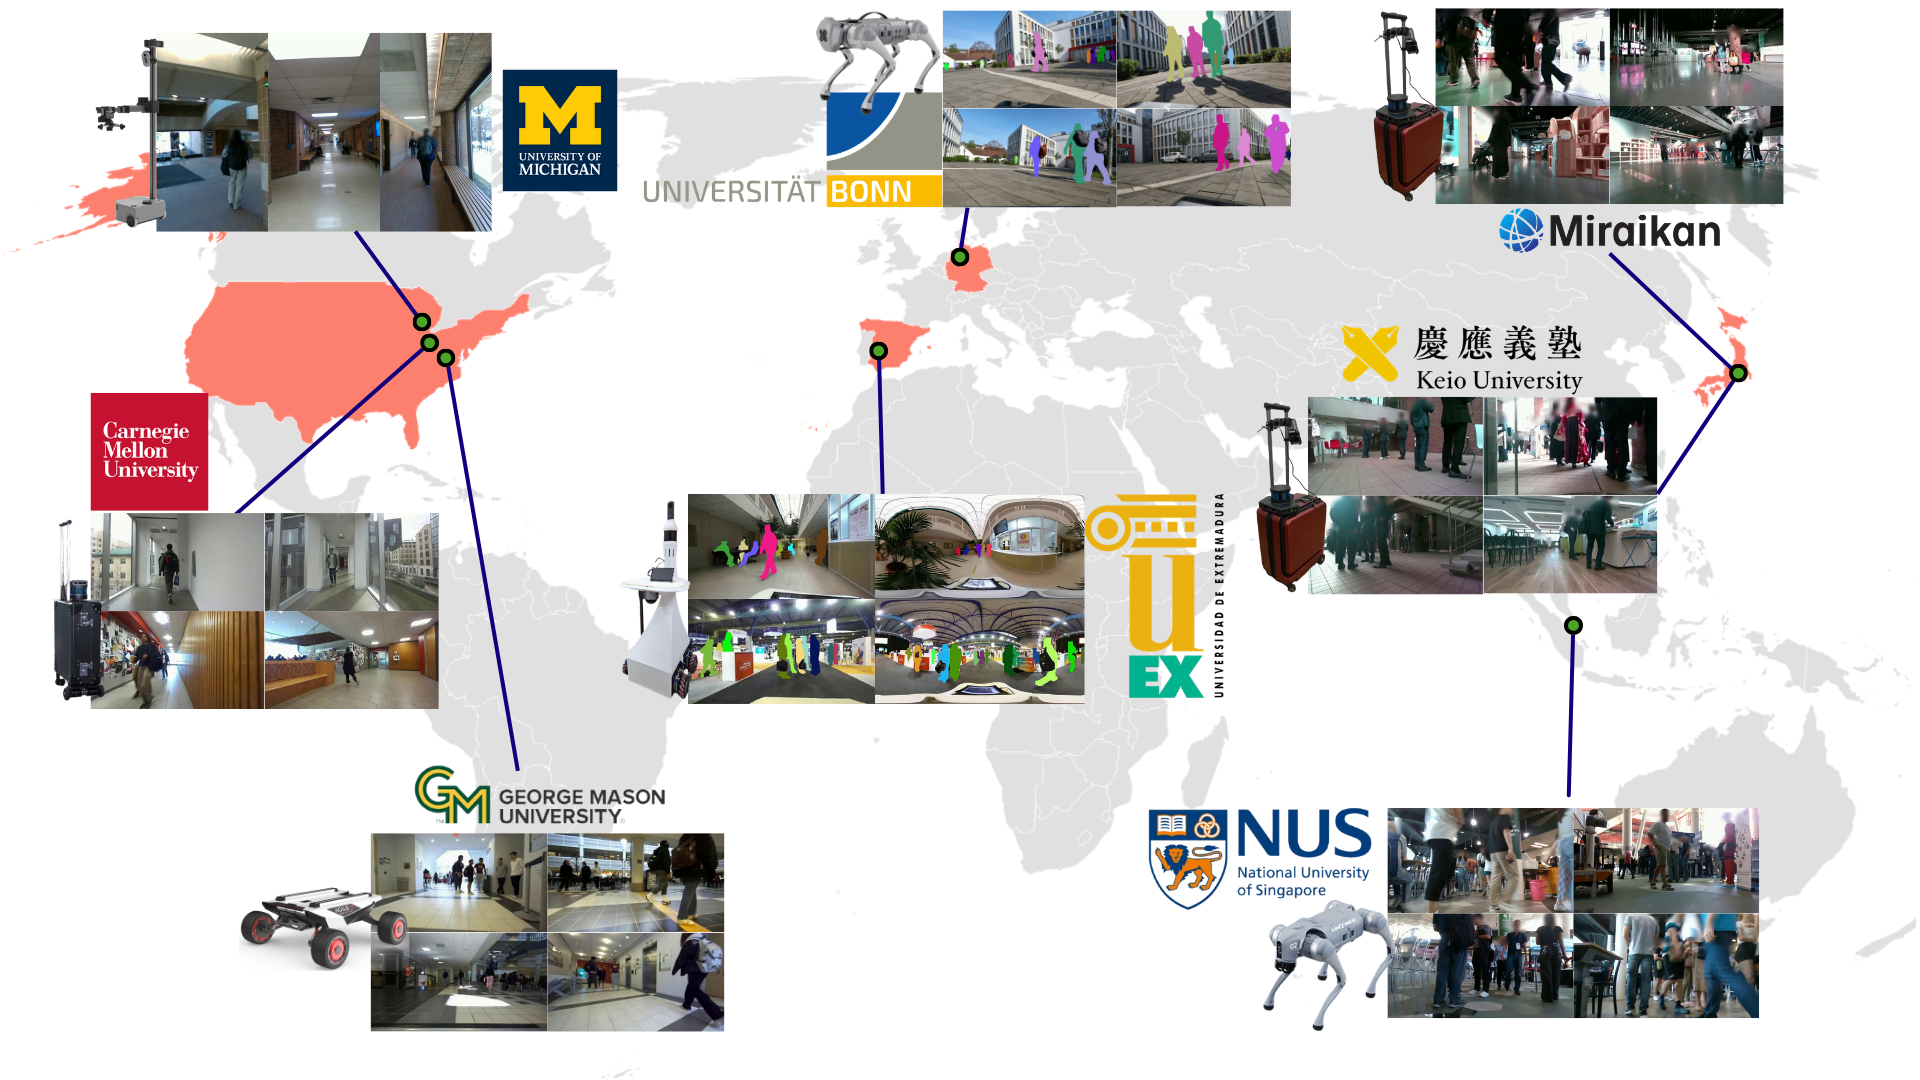
Understanding how robots and humans move in shared spaces is essential for designing effective social navigation policies and predicting human behavior. However, existing datasets often lack the diversity needed to capture differences in culture, geography, and human-robot interaction—factors that strongly shape appropriate social behavior. To address this gap, we introduce ACME, the first multi-cultural and multi-embodiment social navigation and pedestrian trajectory prediction dataset and benchmark. A data collection effort across 8 universities in 5 countries, using 7 robot embodiments, ACME is a large and diverse multi-modal dataset aimed at advancing social navigation research. Unlike prior datasets, it focuses on capturing goal-driven social navigation behavior in challenging social scenarios with explicit robot-crowd interaction through robot speech. To facilitate learning navigation policies and predicting pedestrian trajectories, ACME provides 3D and 2D scene features, odometry, interaction information, and human-annotated pedestrian trajectory labels. We make ACME easy to use by providing both human-readable data for each sensor modality as well as raw binary data. Our qualitative and quantitative analyses show that our dataset captures more challenging scenarios and a larger and diverse distribution of pedestrian behavior when compared to previous datasets.
Onboard Sensor Data
Data Format
Onboard robot data is released in two complementary formats. Raw ROS2 bag files contain all
recorded topics in their original message formats, with each bag corresponding to a single trajectory.
Pre-processed human-readable data is uniformly sampled at 4 Hz and
organized hierarchically: each institution has a dedicated folder, within which each trajectory is a
separate subfolder named with location and recording-date metadata. Inside each trajectory folder,
per-modality subfolders contain time-synchronized files named by timestamp index
(index.extension).
The following data streams are available per trajectory:
- Odometry — CSV with timestamp, X/Y position (odom frame), yaw, and linear/angular velocities.
- Egocentric RGB images — stored as JPEG; some institutions (e.g., GMU, UEx) provide additional 360° views.
- LiDAR point clouds — PCD format from onboard 3D LiDARs.
- Robot speech — 2-column CSV with timestamp and utterance string (NUS, UEx, Miraikan, Keio subsets).
- Sensor calibration — binary static transforms, camera intrinsics text files.
- Scenario tags — CSV mapping trajectory names to scene/pedestrian scenario tags.
Trajectories were segmented using Begin / Discard / End event markers logged during teleoperation, discarding any segments where the robot behaved erratically or the teleoperator was approached for conversation.
The table below summarises the hardware and data duration for each contributing institution:
| Institution | Robot Platform | Sensors | Pose Estimate | BEV Camera | Robot Data (hrs) | BEV Data (hrs) | BEV Trajectories |
|---|---|---|---|---|---|---|---|
| NUS | Unitree GO2 | RealSense D435i, Hesai XT-16 | LiDAR Odometry | GoPro Hero9 | 6.54 | 10.01 | 31,848 |
| Miraikan | Suitcase Robot | RealSense D435i, Velodyne VLP-16 | LiDAR Localization | GoPro Hero12 | 9.43 | 12.39 | 21,322 |
| CMU | Suitcase Robot | Zed 2, Velodyne VLP-16 | LiDAR Localization | GoPro Hero10 | 1.56 | 2.65 | 1,987 |
| Keio | Suitcase Robot | RealSense D435i, Velodyne VLP-16 | LiDAR Localization | GoPro Hero12 | 1.64 | 3.84 | 5,095 |
| UMich | Stretch 2 | RealSense D435i, Velodyne VLP-16 | Wheel Odometry | GoPro Hero13 | 3.20 | 5.10 | 3,728 |
| UEx | Shadow Robot | Zed 2i, Ricoh Theta Z1, Robosense BPearl & Helios | Visual-Inertial Odometry, LiDAR Localization | — | 3.29 | — | — |
| GMU | Scout Mini | Zed 2, Velodyne VLP-16 | Wheel Odometry | Logitech C920 | 3.45 | 2.30 | 3,186 |
| UBonn | Unitree GO1 | GoPro, Velodyne VLP-16 | LiDAR Odometry | GoPro Hero12 | 2.43 | 7.27 | 4,892 |
Analysis
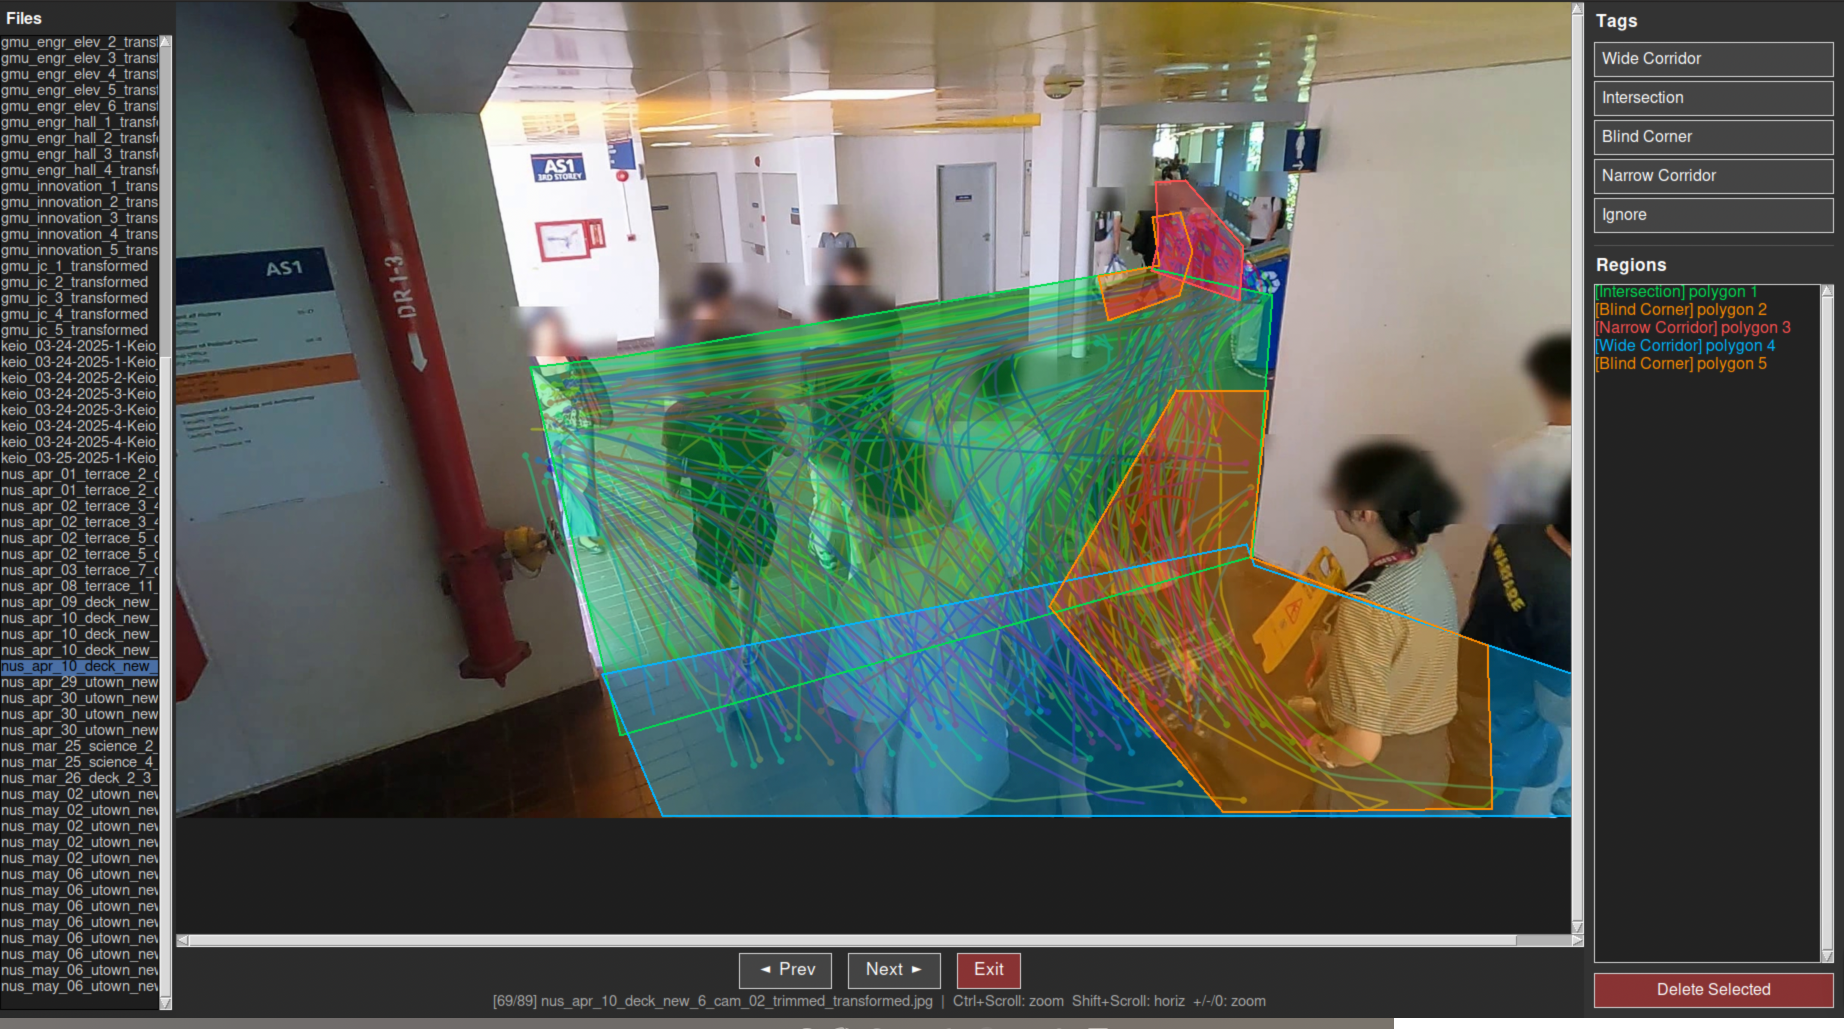
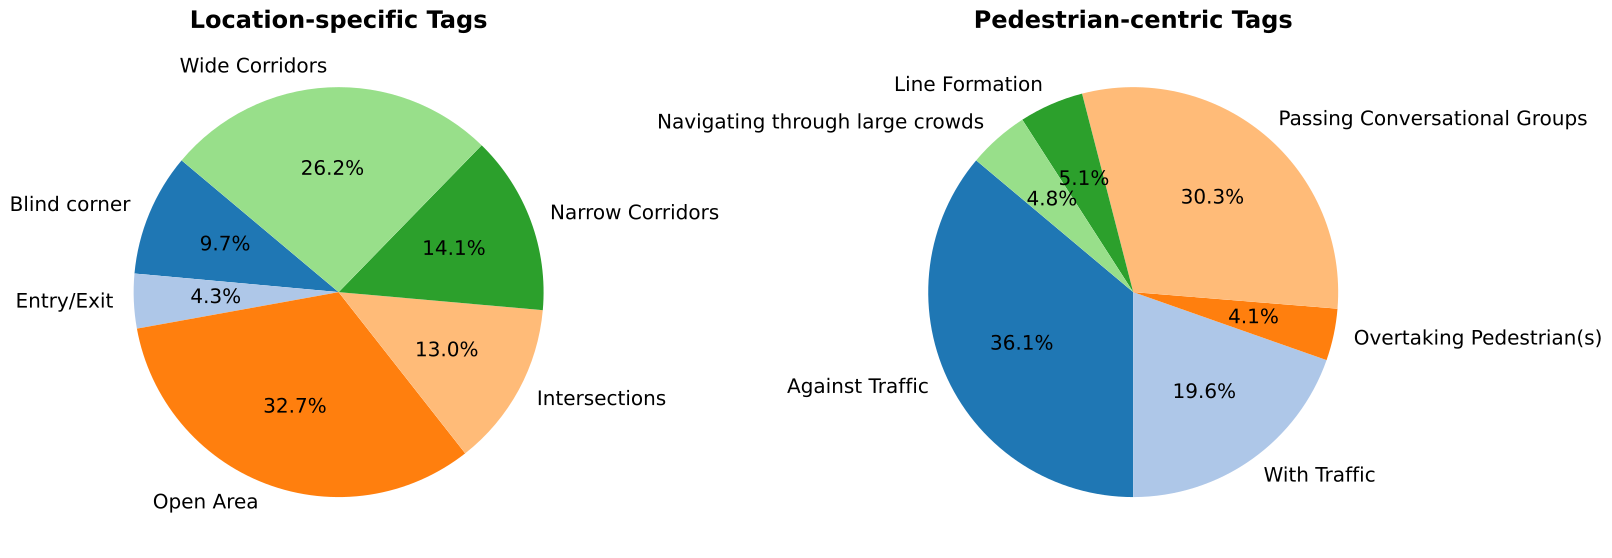
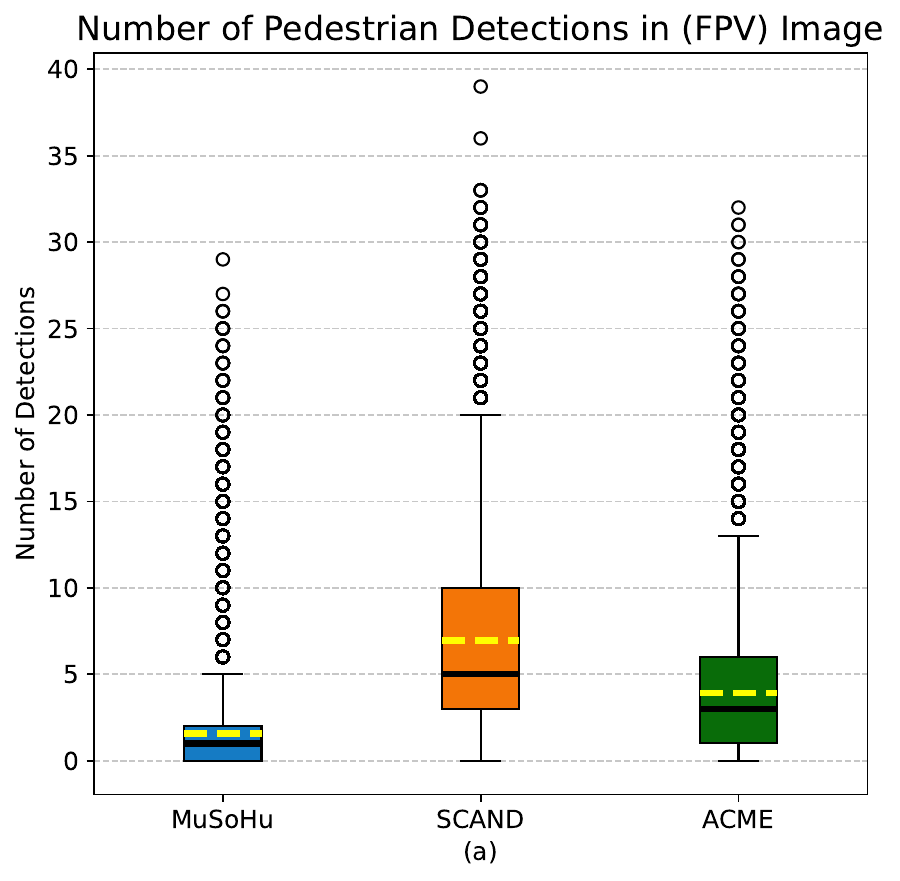
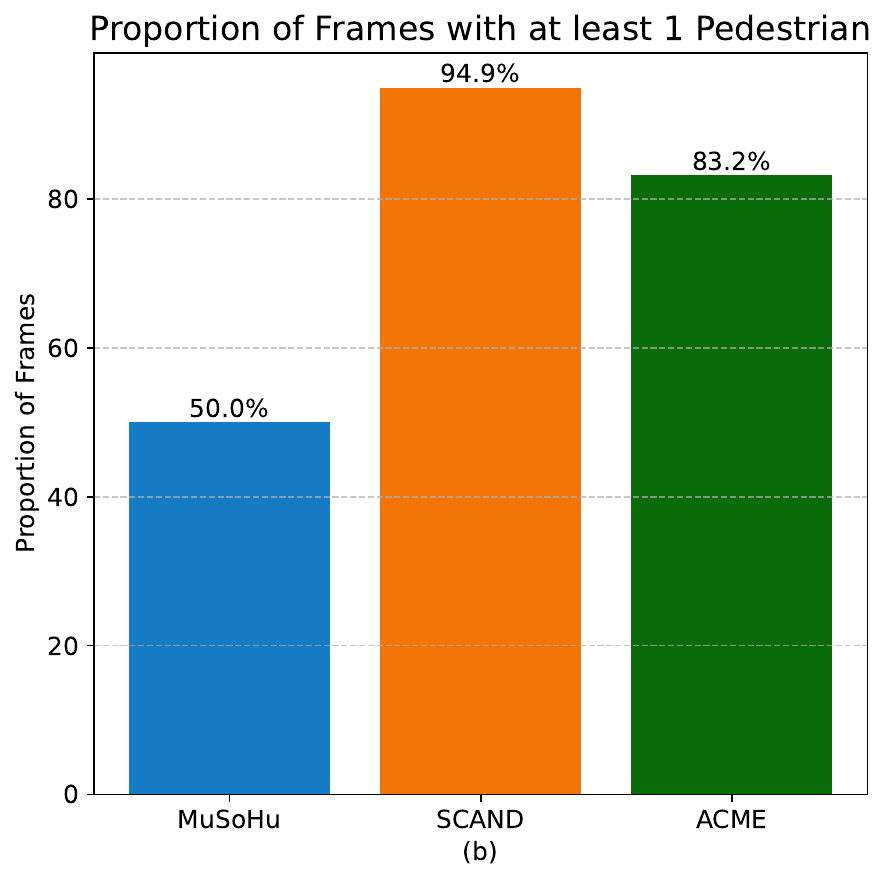
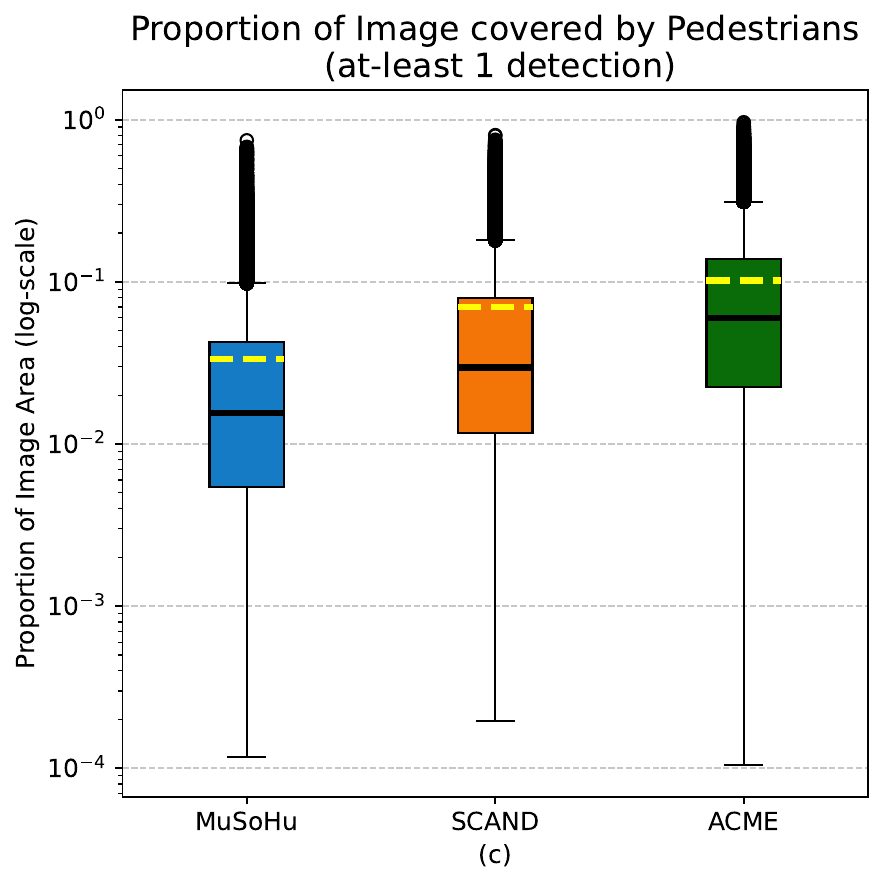
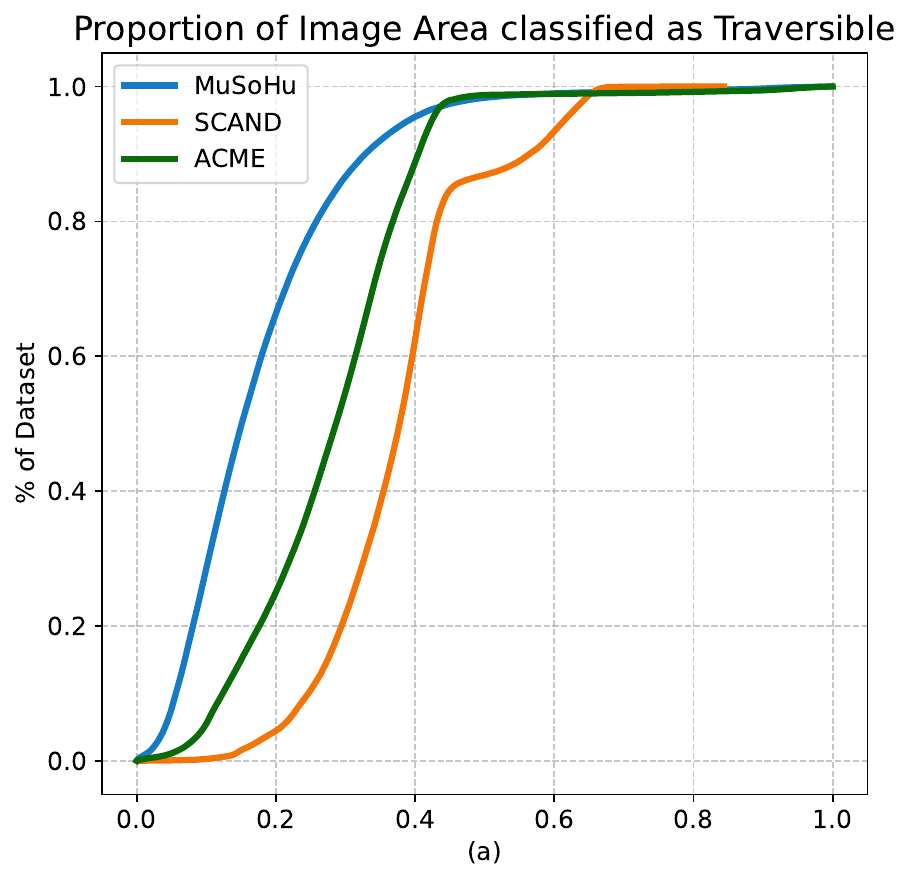
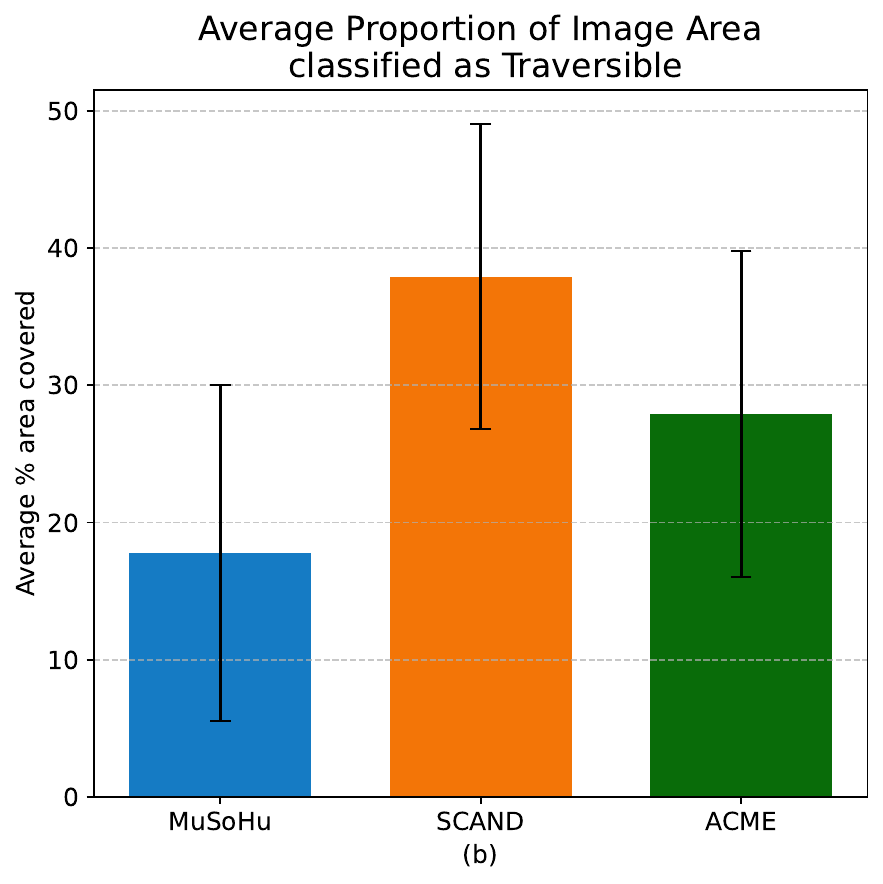
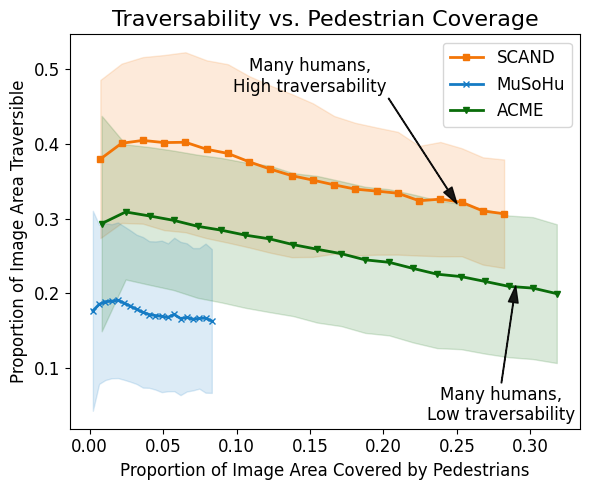
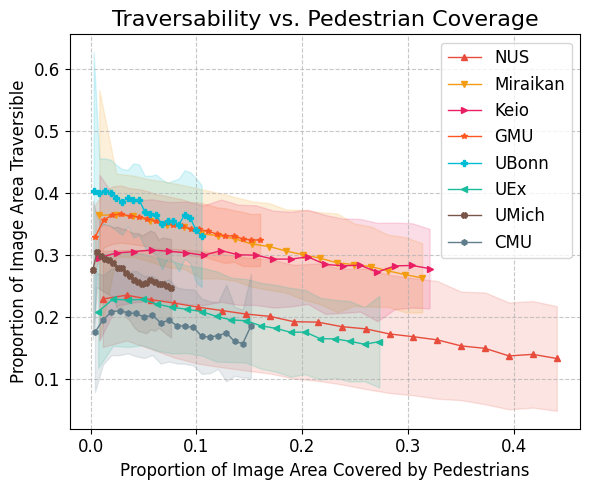
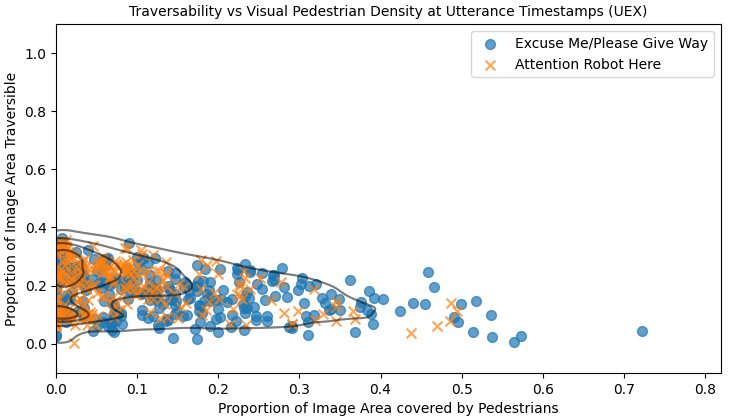
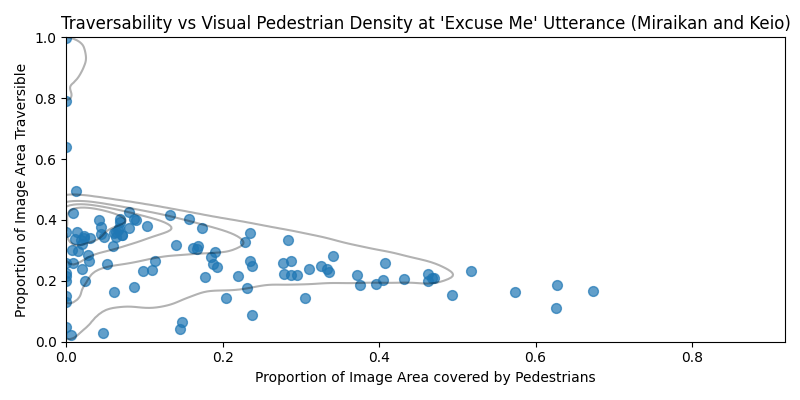
We characterize scenario complexity along three axes: pedestrian density, traversability, and degree of social compliance (measured via geometric planner failures). Compared to SCAND and MuSoHu, ACME captures scenarios with higher crowd density closer to the robot and lower traversable space, reflecting its focus on challenging, goal-directed social navigation.
Scenario Distribution
Pedestrian Density & Traversability
Robot Speech Analysis
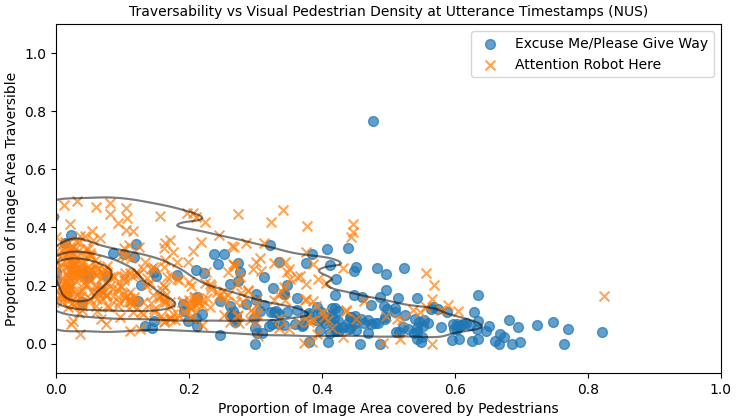
Trajectories collected at NUS, UEx, Miraikan, and Keio include robot speech annotations. Three utterances were available: "Excuse Me / Please Give Way" (used when navigating through crowds requiring passage) and "Attention, Robot Here" (used as an awareness cue in low-visibility or distracted-pedestrian situations).
Vision Navigation Model Benchmark
We benchmark ViNT and NoMAD — two state-of-the-art foundational vision navigation models — on ACME alongside SCAND and MuSoHu. Both models perform considerably worse on ACME, demonstrating the dataset's greater challenge for generalizable navigation policies.
| Model | Dataset | FDE (m) | MSE | Cosine Sim. | MAOE (°) | Mean AOE (°) | Total AOE (°) |
|---|---|---|---|---|---|---|---|
| ViNT | ACME | 0.85 ± 0.60 | 0.24 ± 0.30 | 0.95 ± 0.23 | 12.58 ± 26.51 | 8.24 ± 19.93 | 41.22 ± 99.64 |
| SCAND | 0.46 ± 0.52 | 0.11 ± 0.23 | 0.98 ± 0.13 | 5.48 ± 15.47 | 3.68 ± 11.31 | 18.41 ± 56.53 | |
| MuSoHu | 0.83 ± 0.49 | 0.21 ± 0.34 | 0.96 ± 0.18 | 14.39 ± 21.25 | 10.16 ± 16.26 | 50.80 ± 81.30 | |
| NoMAD | ACME | 1.44 ± 1.00 | 0.63 ± 0.77 | 0.93 ± 0.22 | 20.68 ± 31.35 | 11.74 ± 19.75 | 93.88 ± 158.00 |
| SCAND | 0.79 ± 0.92 | 0.30 ± 0.59 | 0.98 ± 0.12 | 6.86 ± 16.39 | 4.11 ± 10.73 | 32.89 ± 85.83 | |
| MuSoHu | 1.53 ± 0.88 | 0.63 ± 0.77 | 0.94 ± 0.19 | 18.83 ± 26.10 | 11.80 ± 17.27 | 94.42 ± 138.16 |
BEV Videos and Pedestrian GT Annotated Trajectories
Data Format
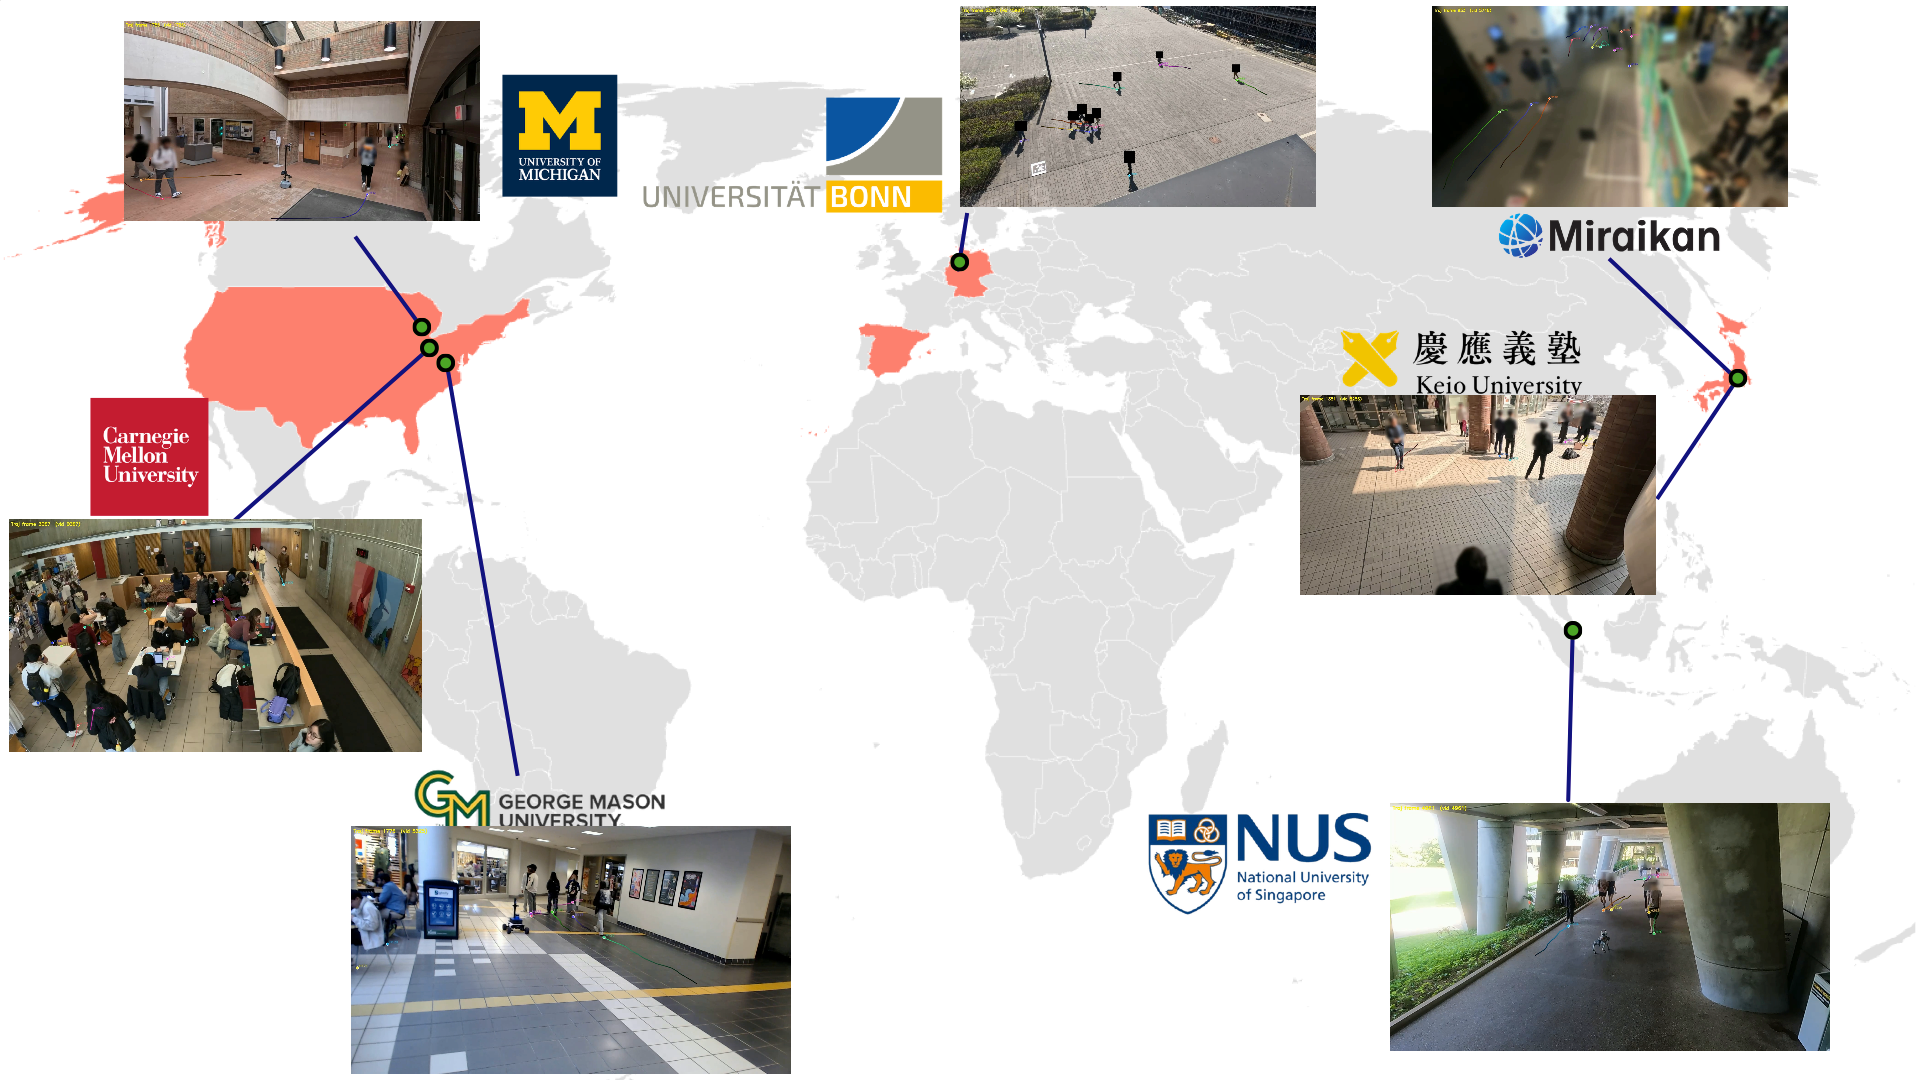
Overhead Bird's-Eye-View (BEV) cameras were deployed at seven of the eight collection sites (NUS, Miraikan, CMU, Keio, UMich, GMU, UBonn). The BEV pipeline proceeds in four stages:
- Automated tracking — ByteTrack detects and tracks all pedestrians at 10 Hz from the BEV video feed.
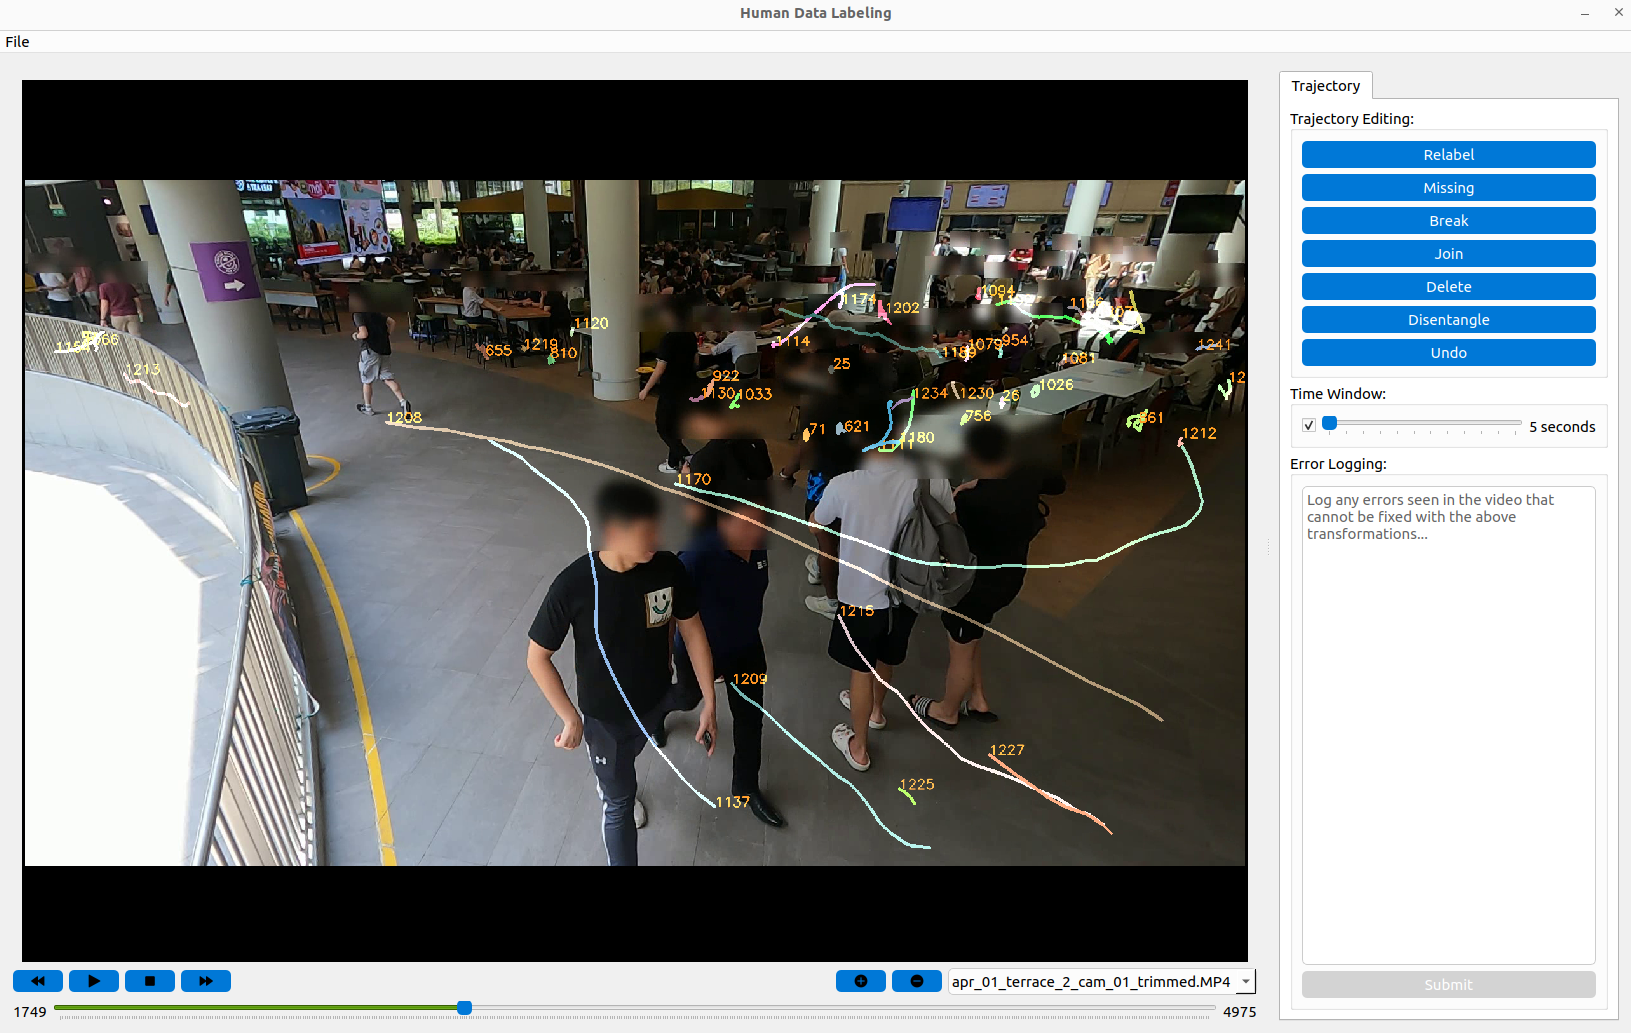
- Human verification — Co-authors manually inspect and correct trajectories using a custom PyQt tool supporting relabel, break, join, delete, disentangle, and undo operations.
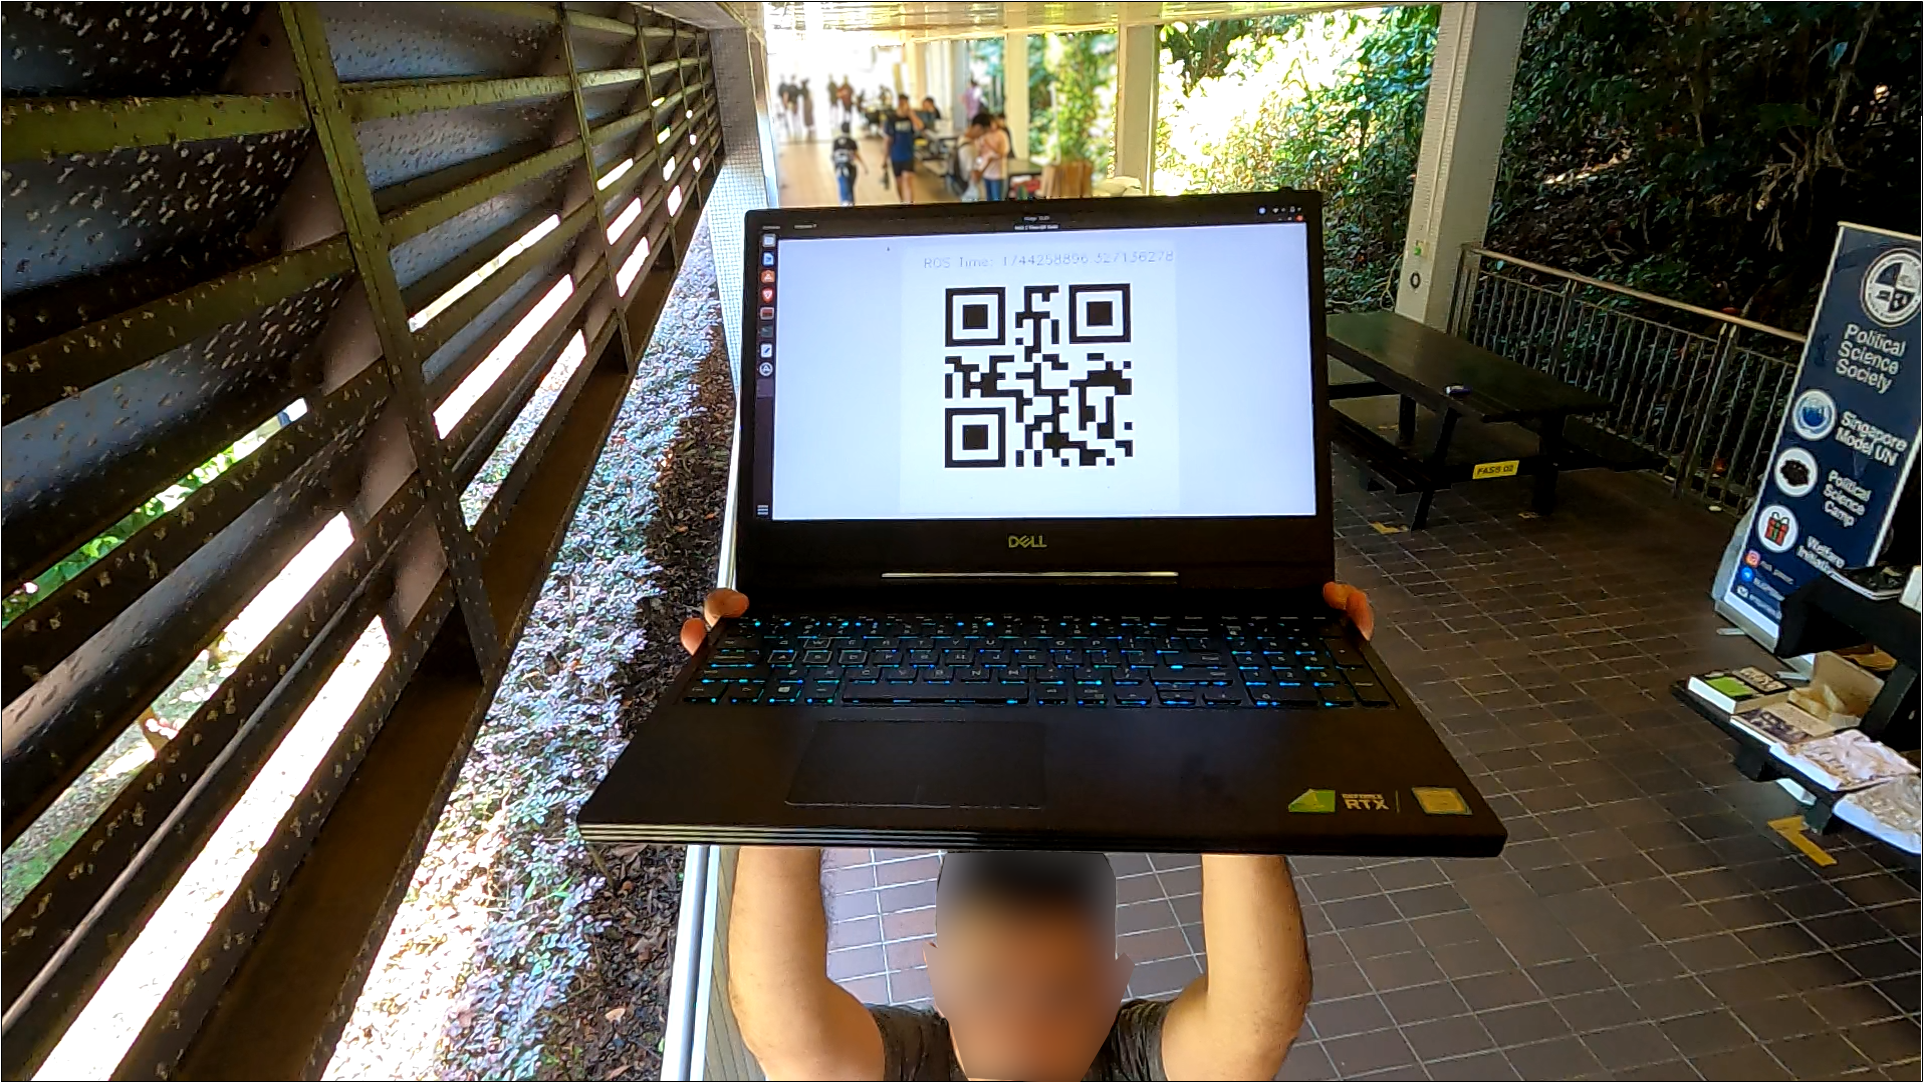
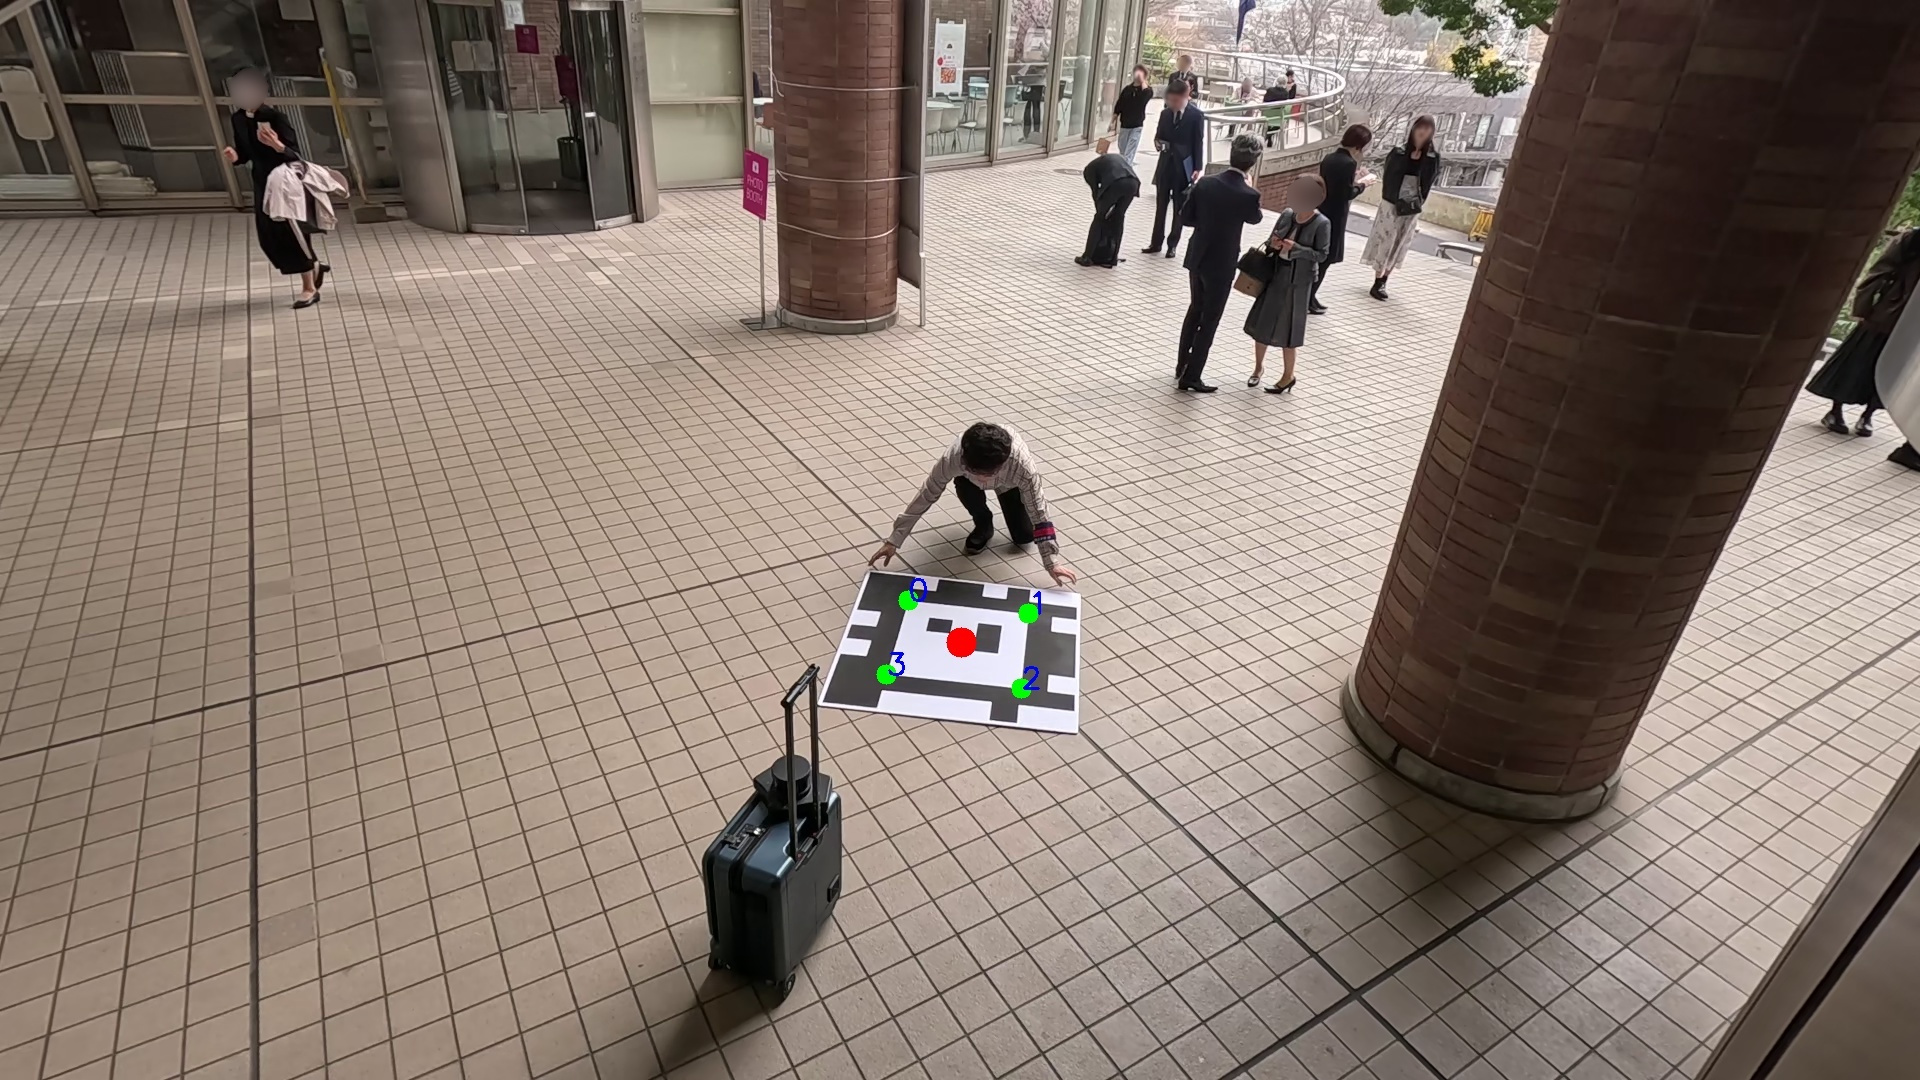
- Metric calibration — 2D-to-2D homography transforms (estimated via AprilTag markers or ground-truth keypoints) convert pixel coordinates to ground-plane metric coordinates.
- Post-processing & distribution — Trajectories shorter than 3.2 s are discarded; noise jumps (>5 m/s) are linearly interpolated or removed; trajectories are smoothed with a window of 5 frames; stationary segments are flagged. Final data is downsampled to 2.5 Hz and released in ETH/UCY-compatible
.txtformat for plug-in use with trajectory prediction models.
Anonymization varies by institution IRB requirements:
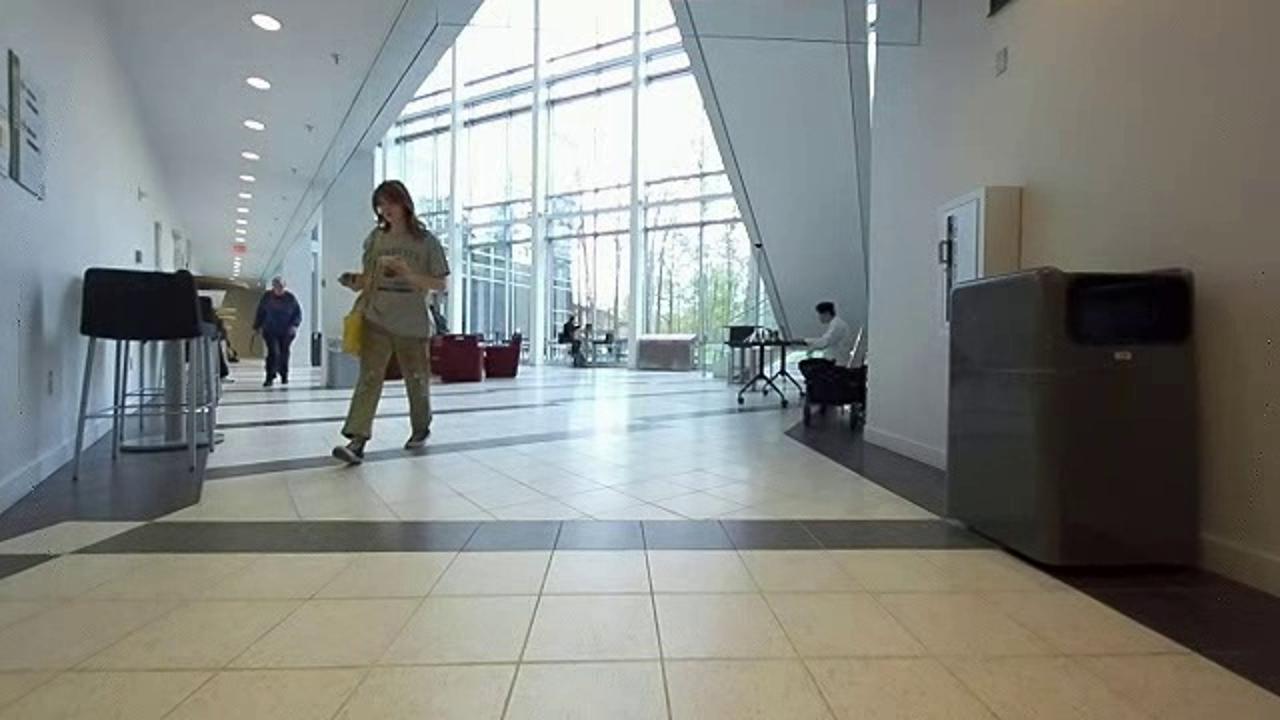
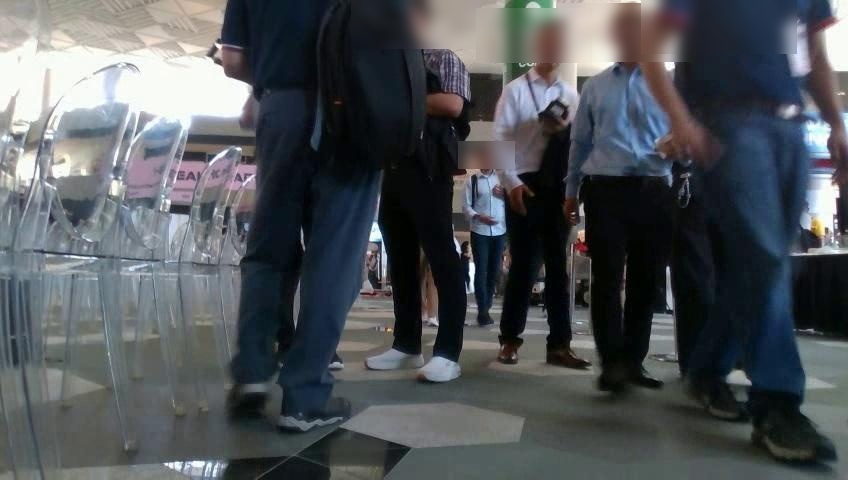
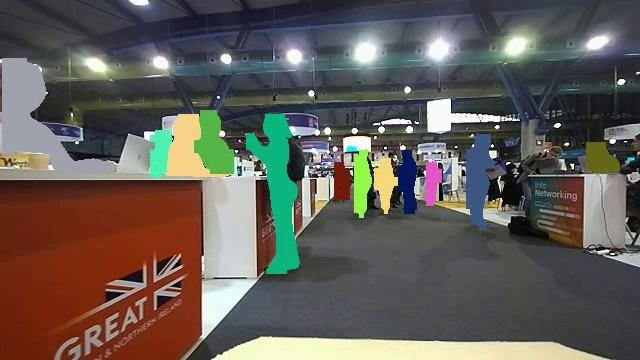
Pedestrian Masks, Bounding Boxes and Keypoints provided for maximum data utility within privacy regulations.
To compensate for information loss from anonymization, bounding-box, segmentation-mask, and pose-keypoint detections (YOLOv8 + ByteTrack) are included alongside each RGB frame.

Analysis
Trajectory Statistics vs. Prior Datasets
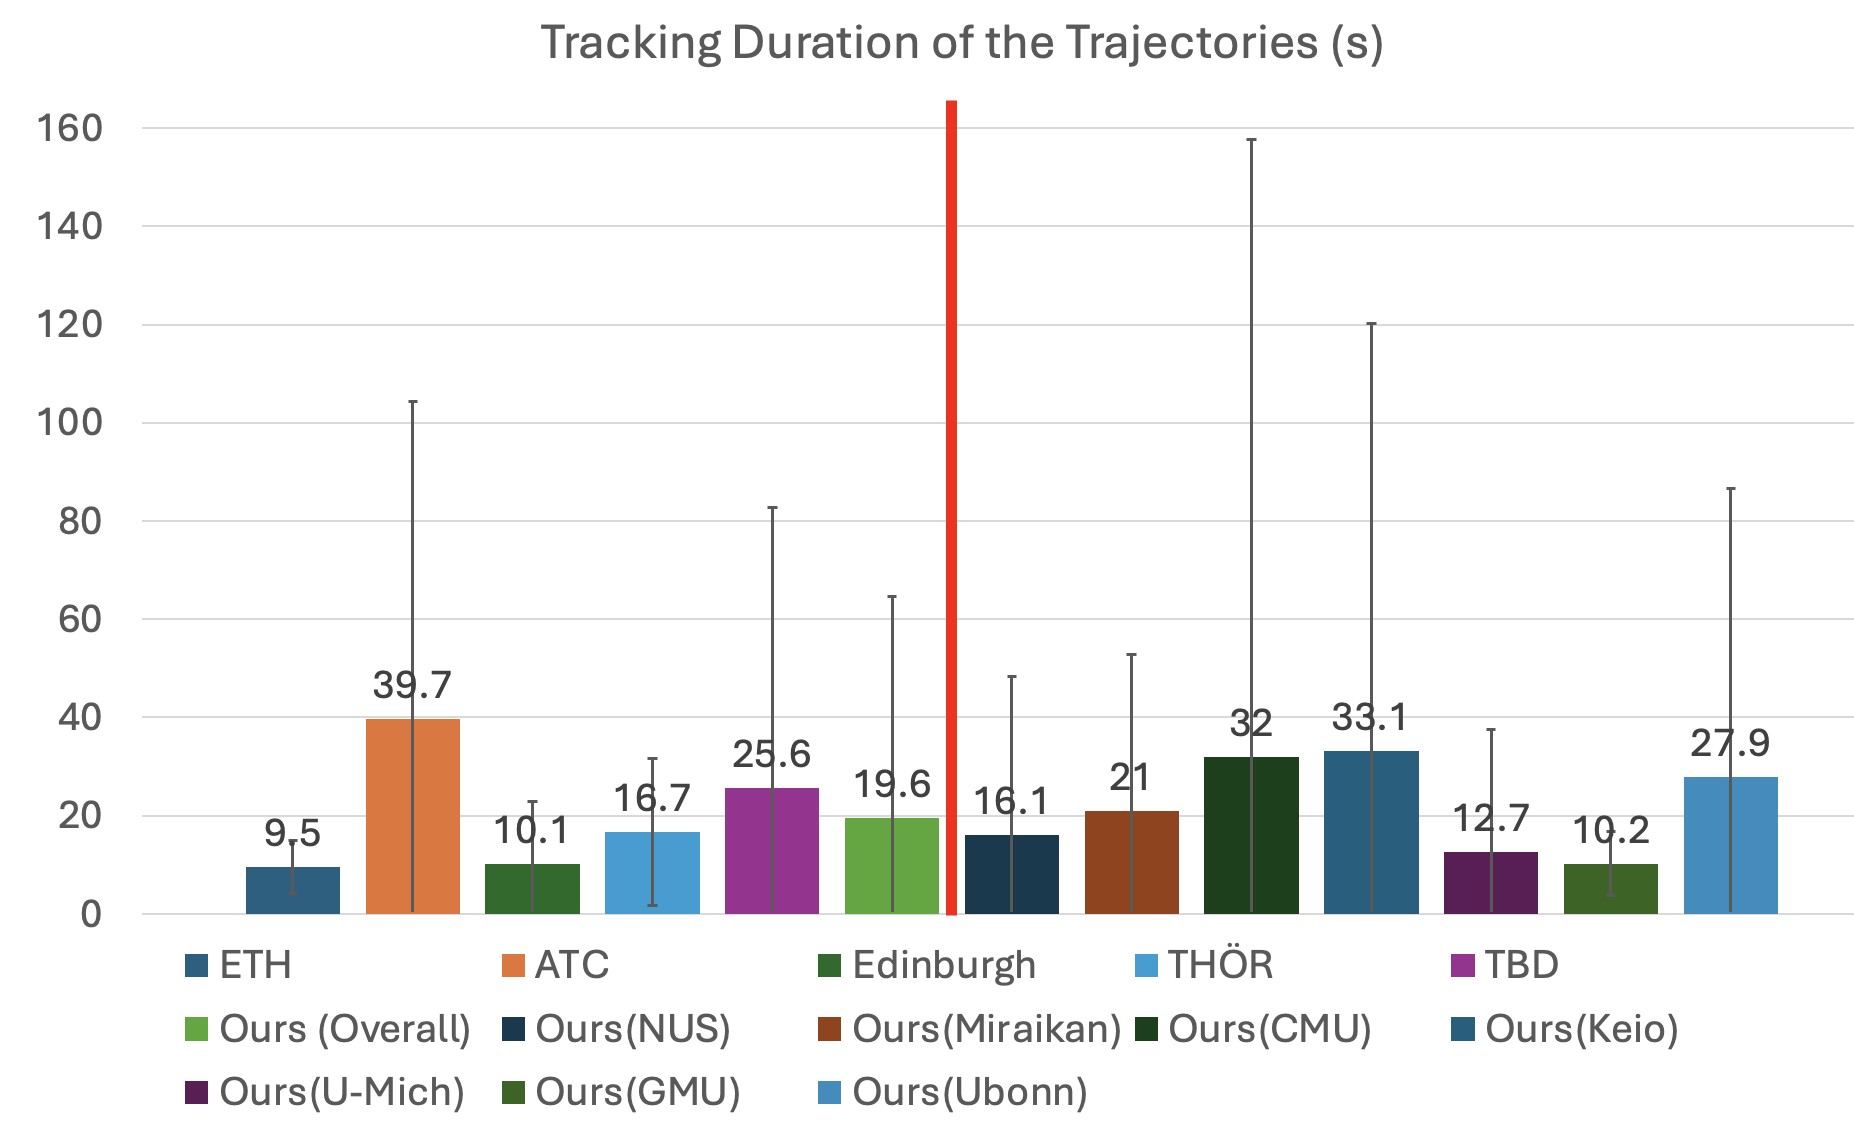
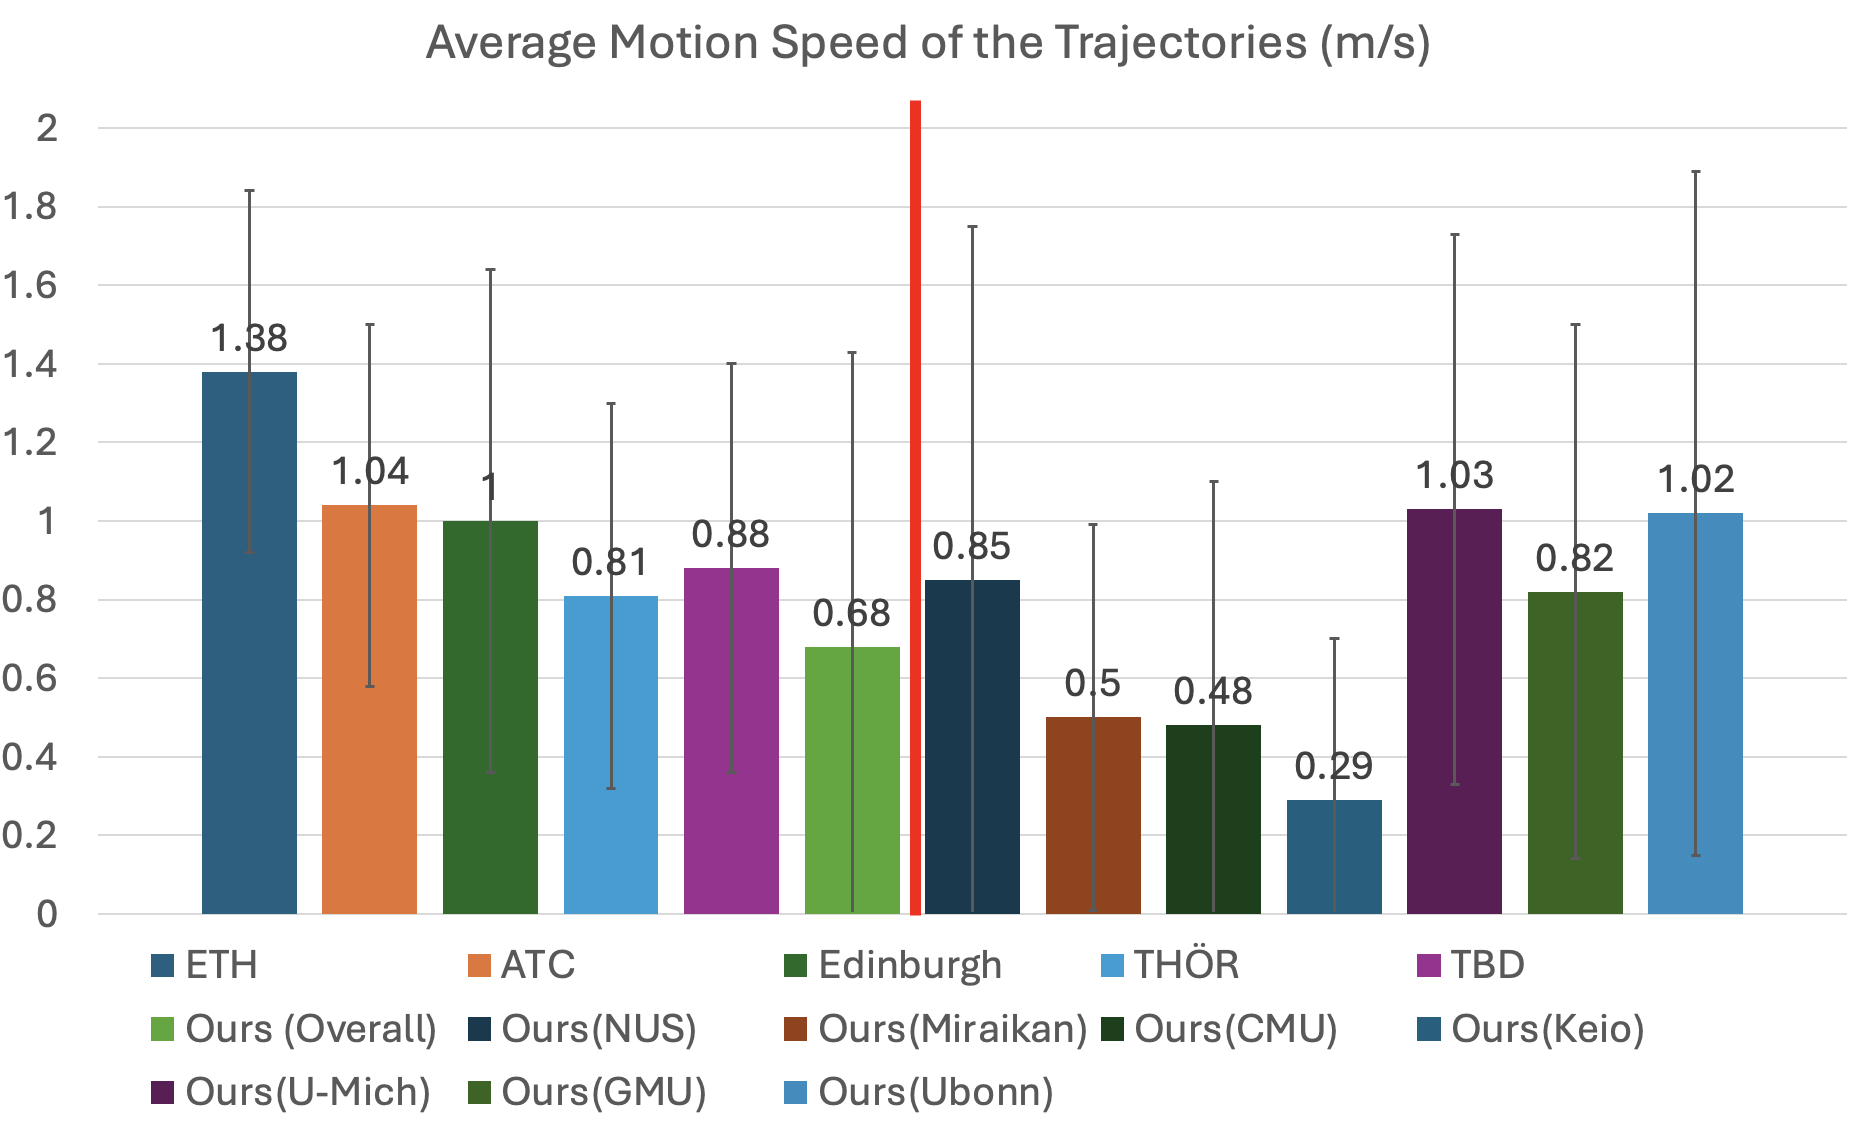
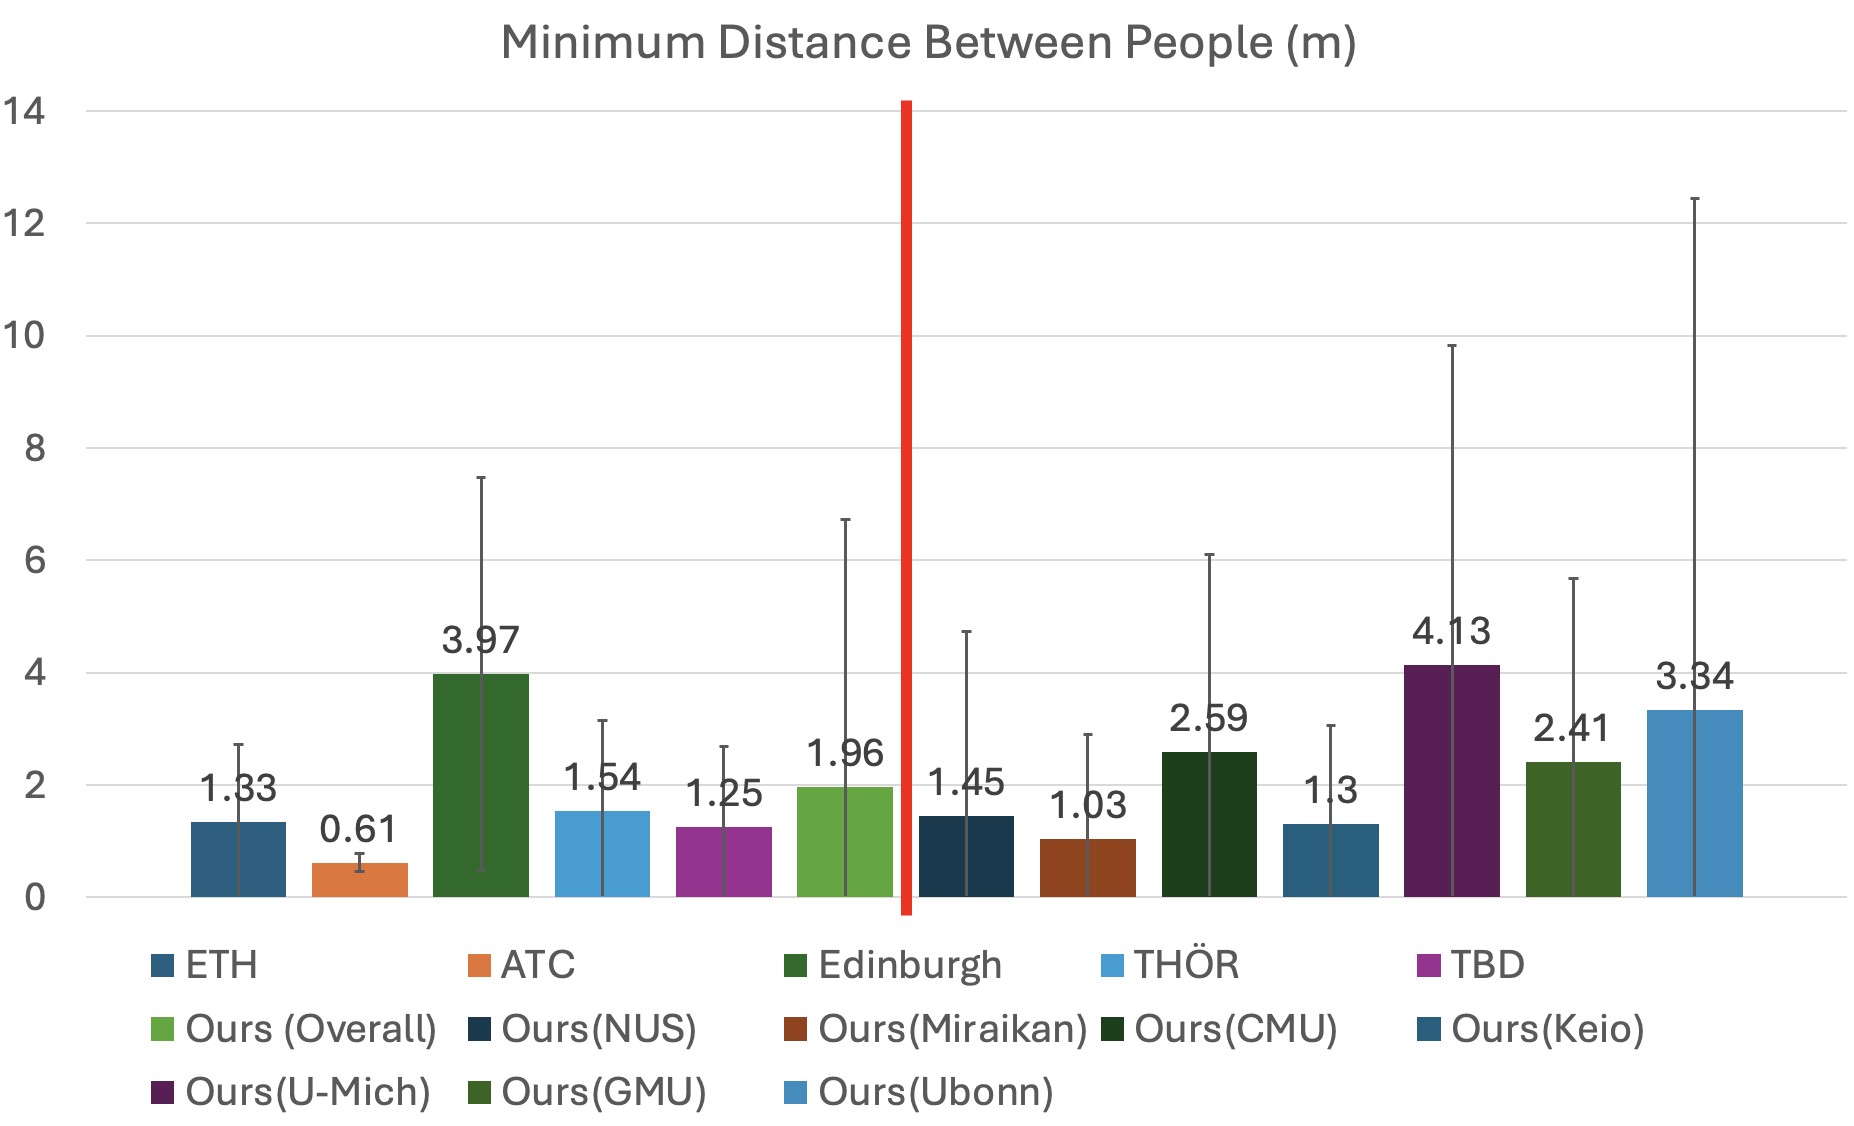
ACME contains 72,058 human-verified pedestrian trajectories over 43.5 hours — roughly 4× longer and 7× more trajectories than the previously largest verified metric dataset (TBD). It also spans the widest standard deviation in average speed (±0.75 m/s) and minimum interpersonal distance (±4.76 m), reflecting the breadth of cultural and environmental contexts captured.
Trajectory Prediction Model Benchmark
Five state-of-the-art trajectory prediction models were trained on ETH/UCY and evaluated on both ETH/UCY and ACME. While models improve progressively on ETH/UCY, performance on ACME degrades substantially for newer models — indicating ACME captures more challenging and diverse human behavior that current models fail to generalize to.
| Model | ADE / FDE (m) | |
|---|---|---|
| ETH/UCY | ACME | |
| SocialGAN | 0.34 / 0.71 | 0.68 / 1.57 |
| AgentFormer | 0.23 / 0.47 | 0.75 / 2.12 |
| SGNet | 0.22 / 0.48 | 0.61 / 1.31 |
| TUTR | 0.22 / 0.44 | 1.30 / 2.73 |
| MoFlow | 0.21 / 0.41 | 1.97 / 2.03 |
Cross-Cultural Comparison — Walking Speed
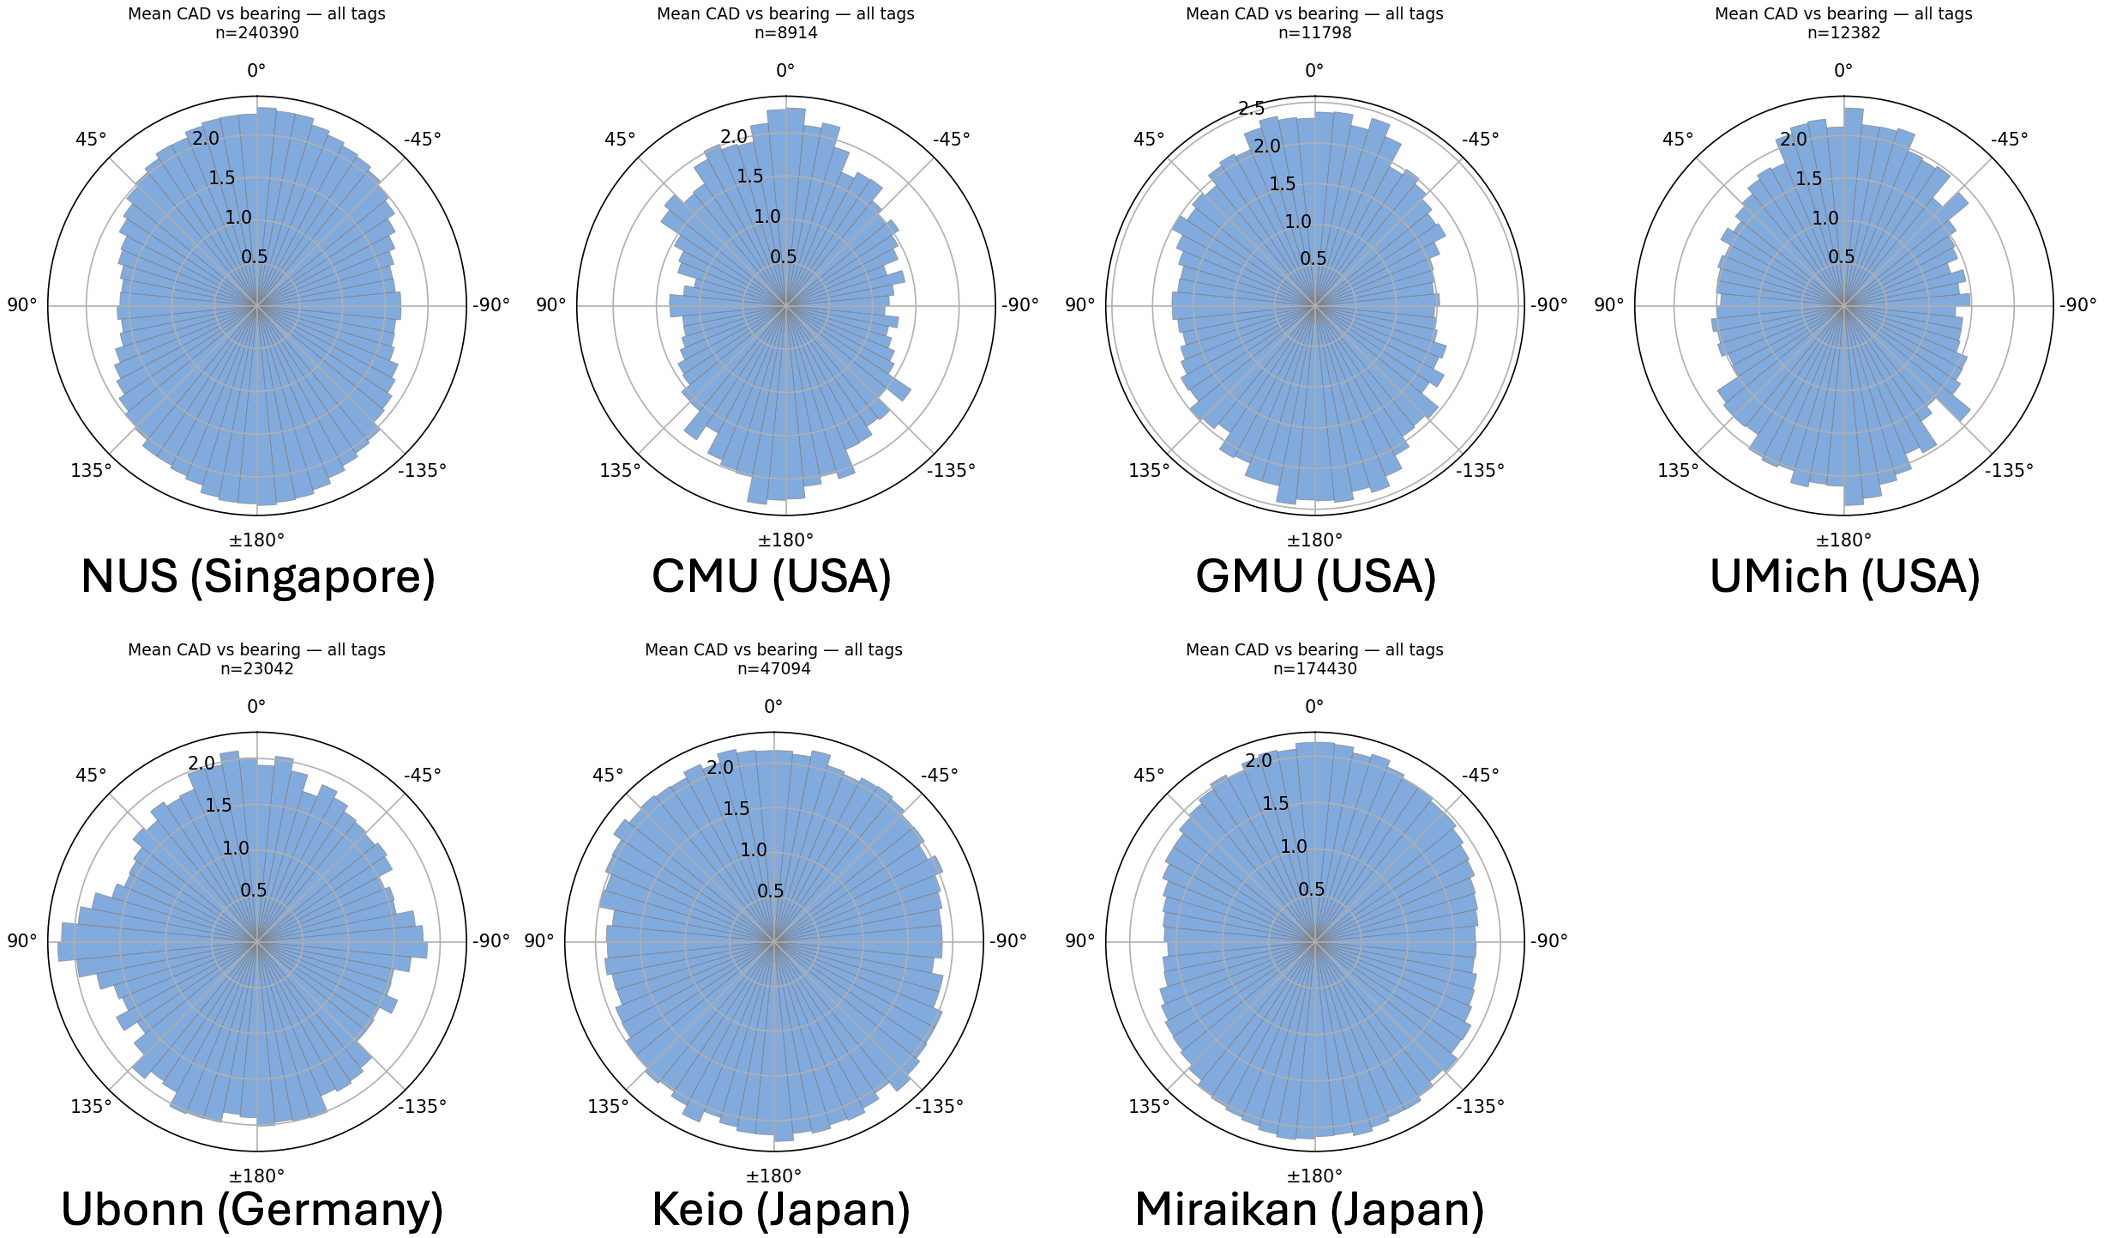
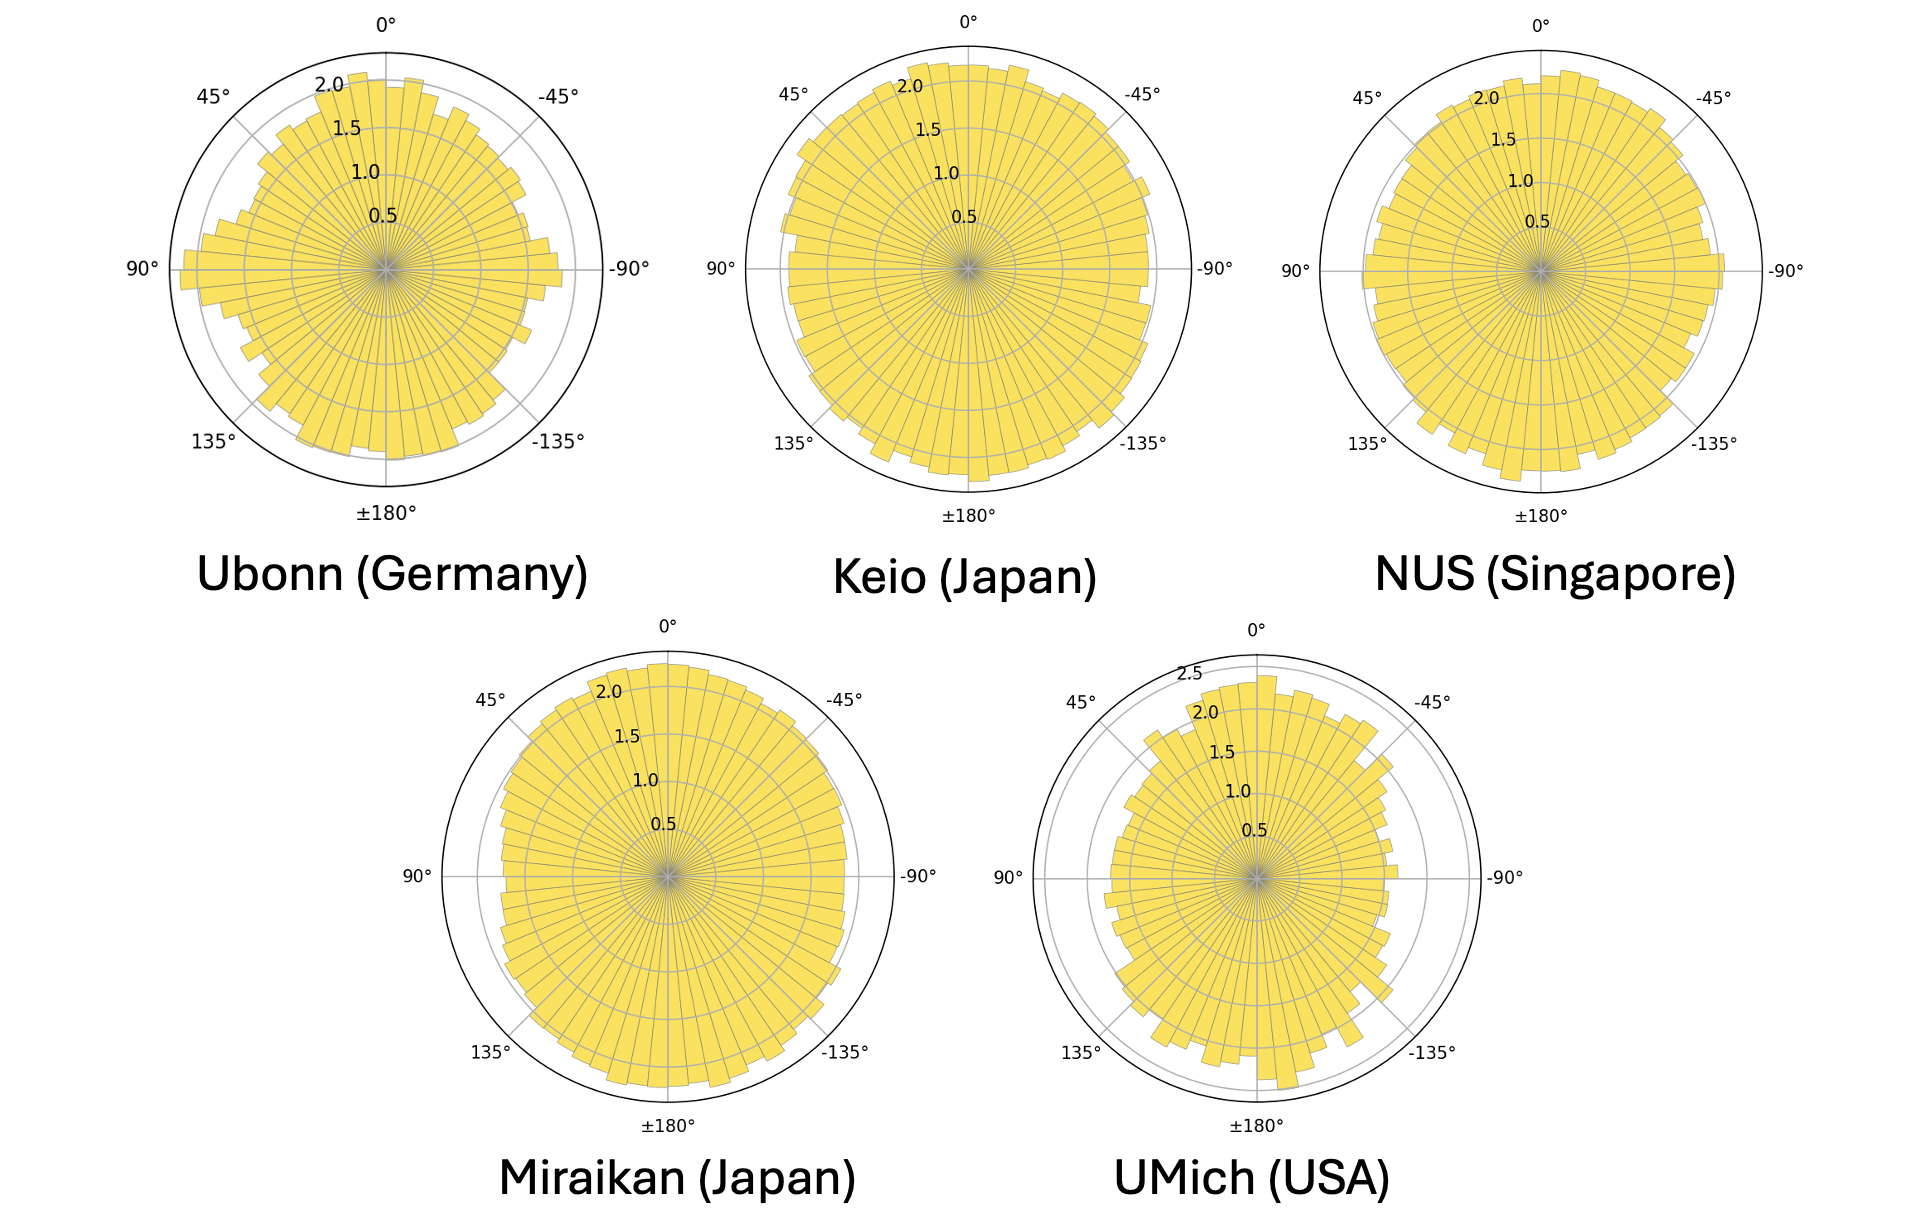
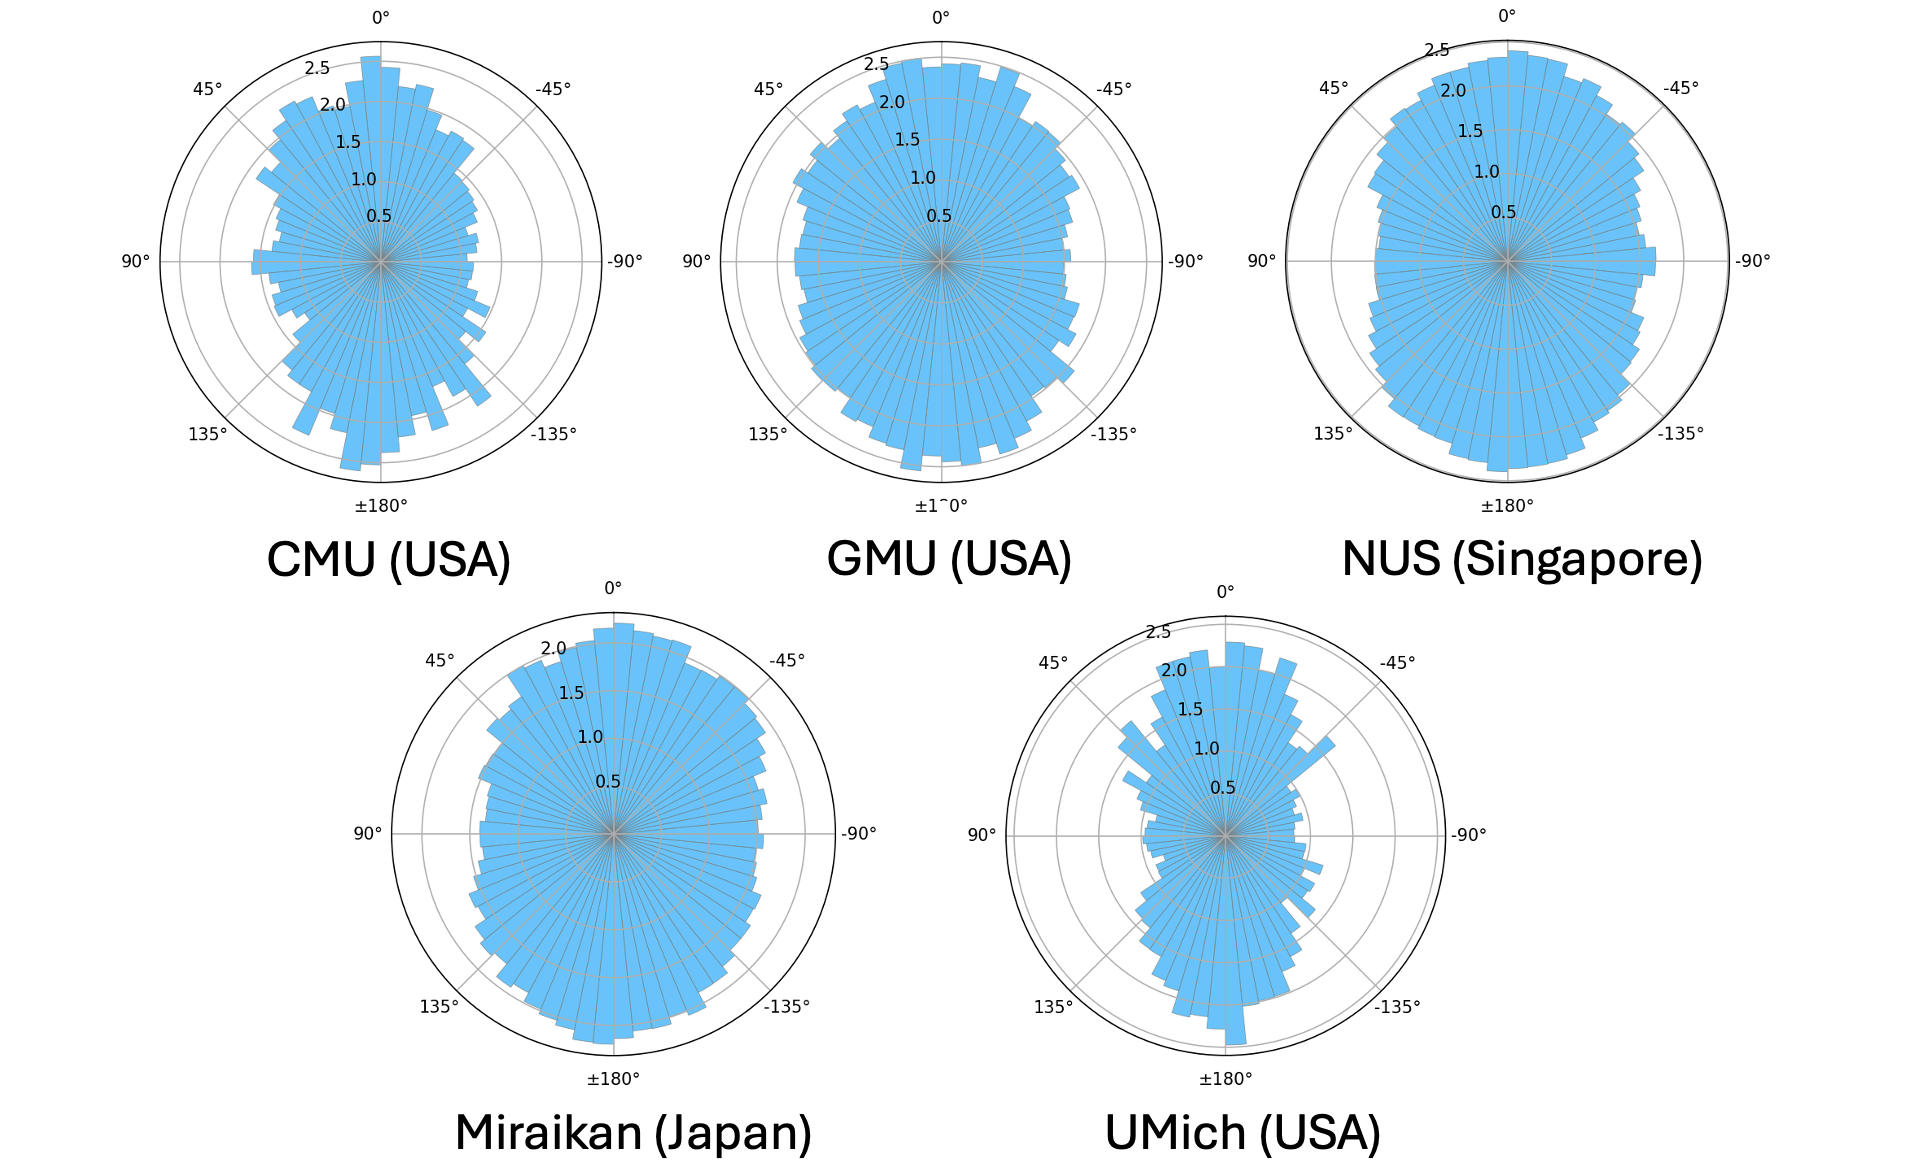
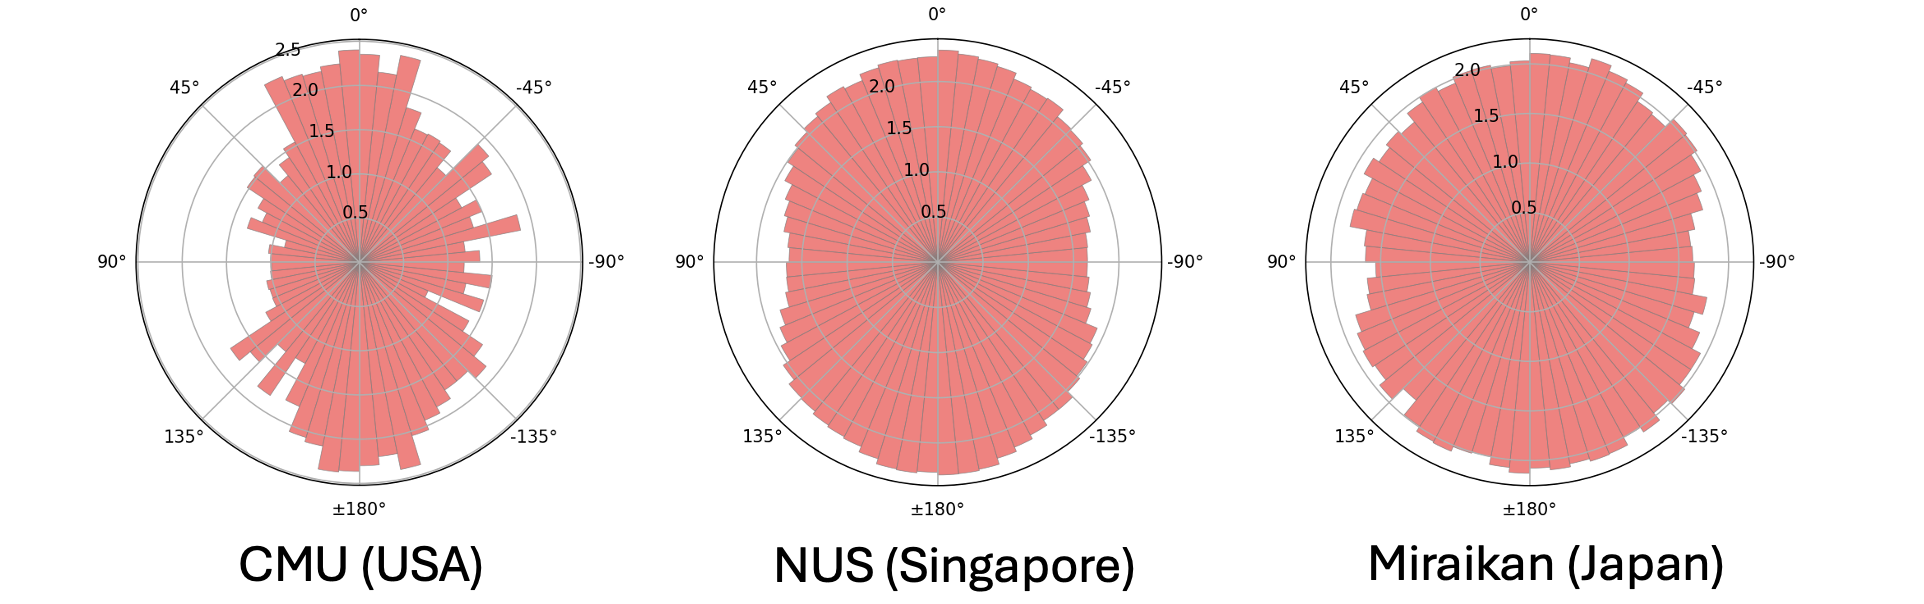
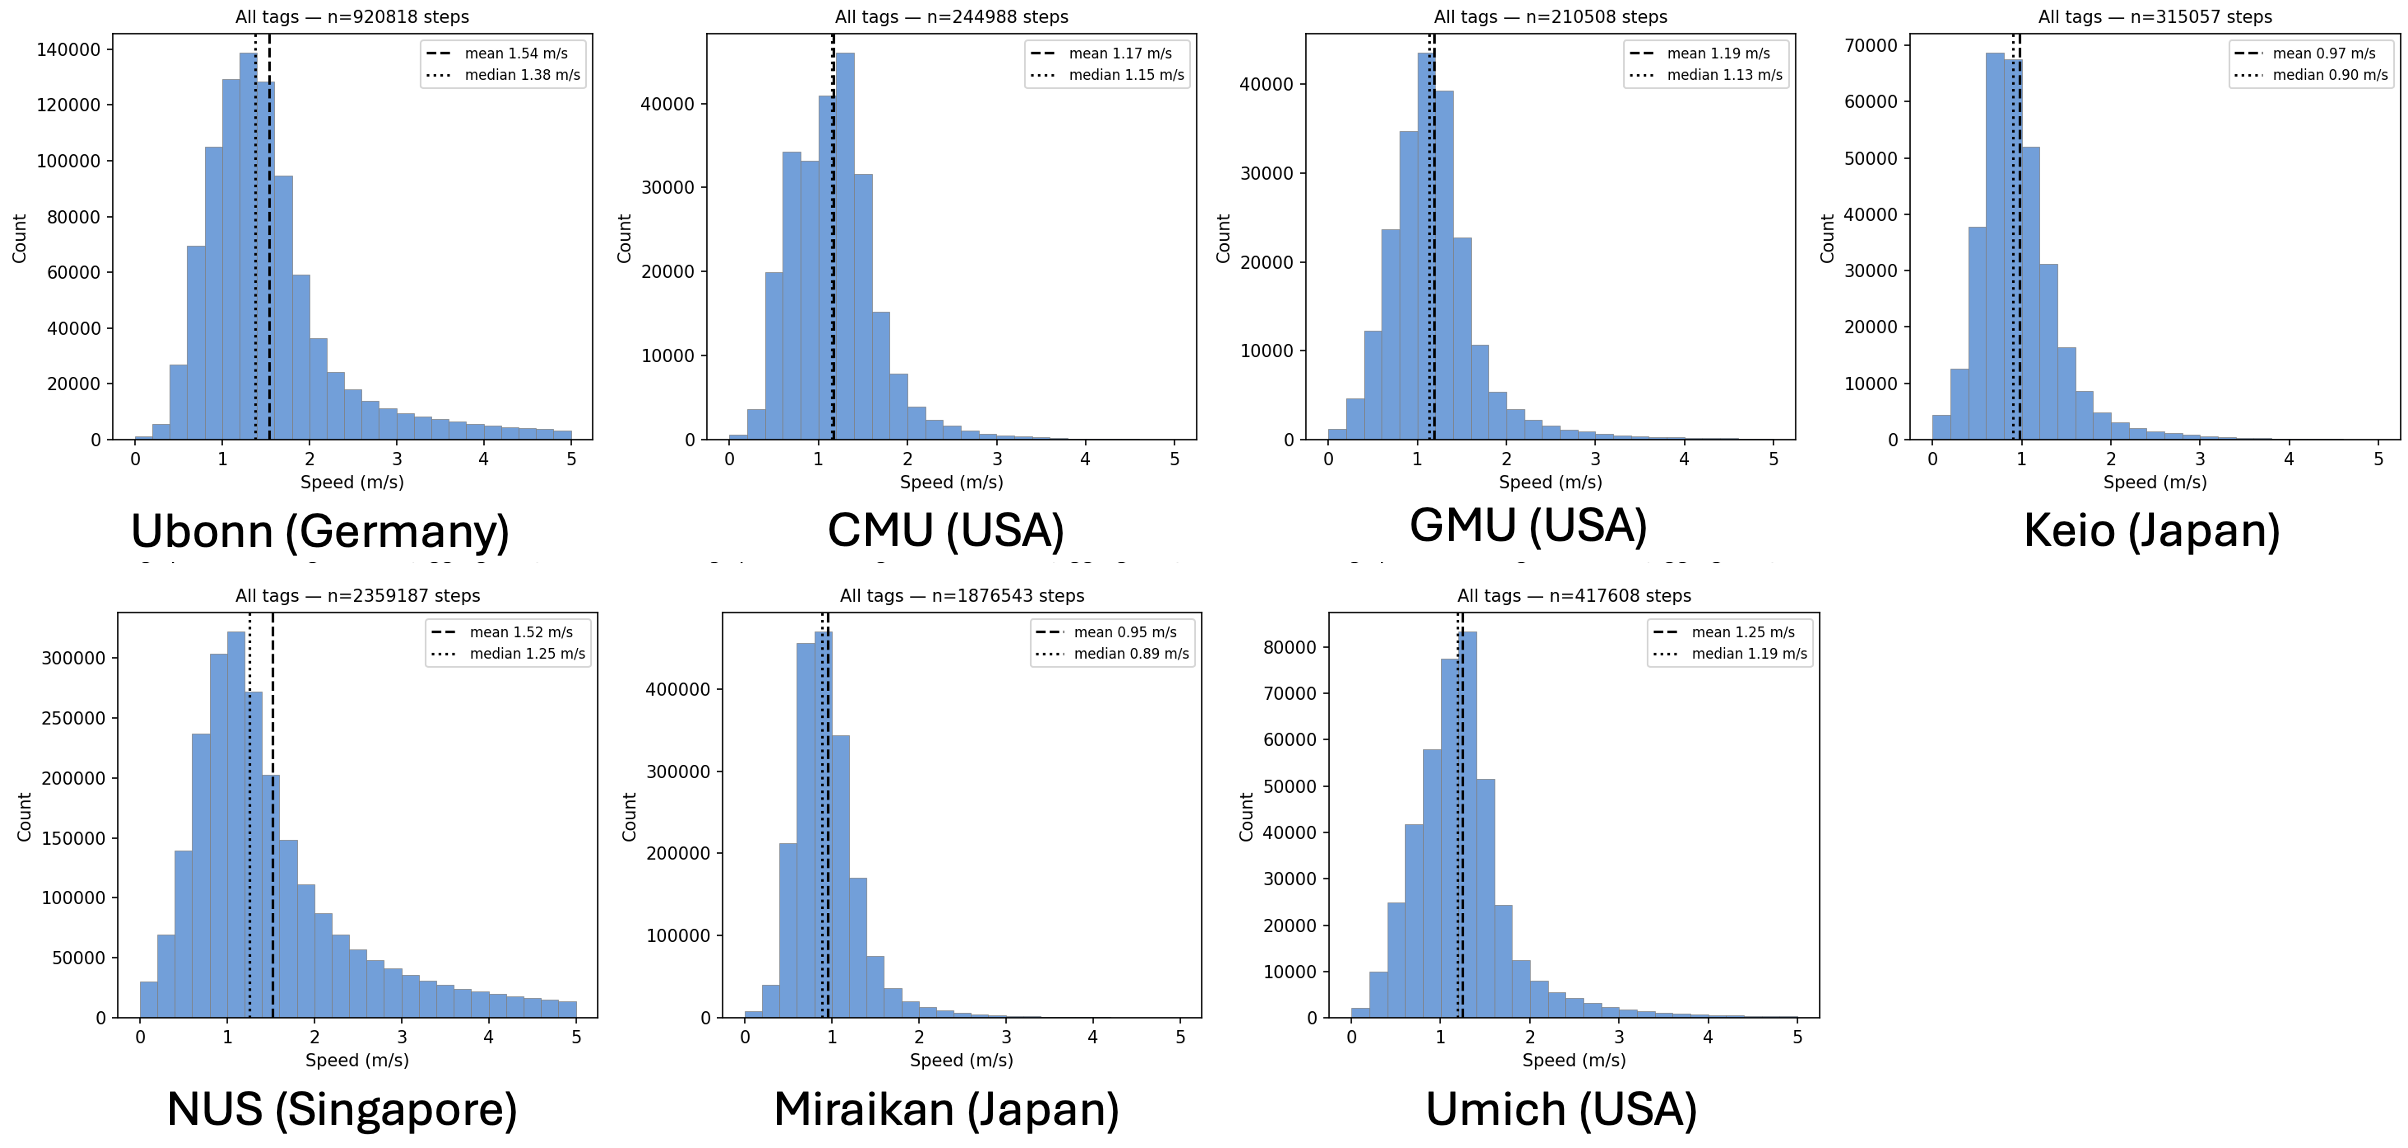
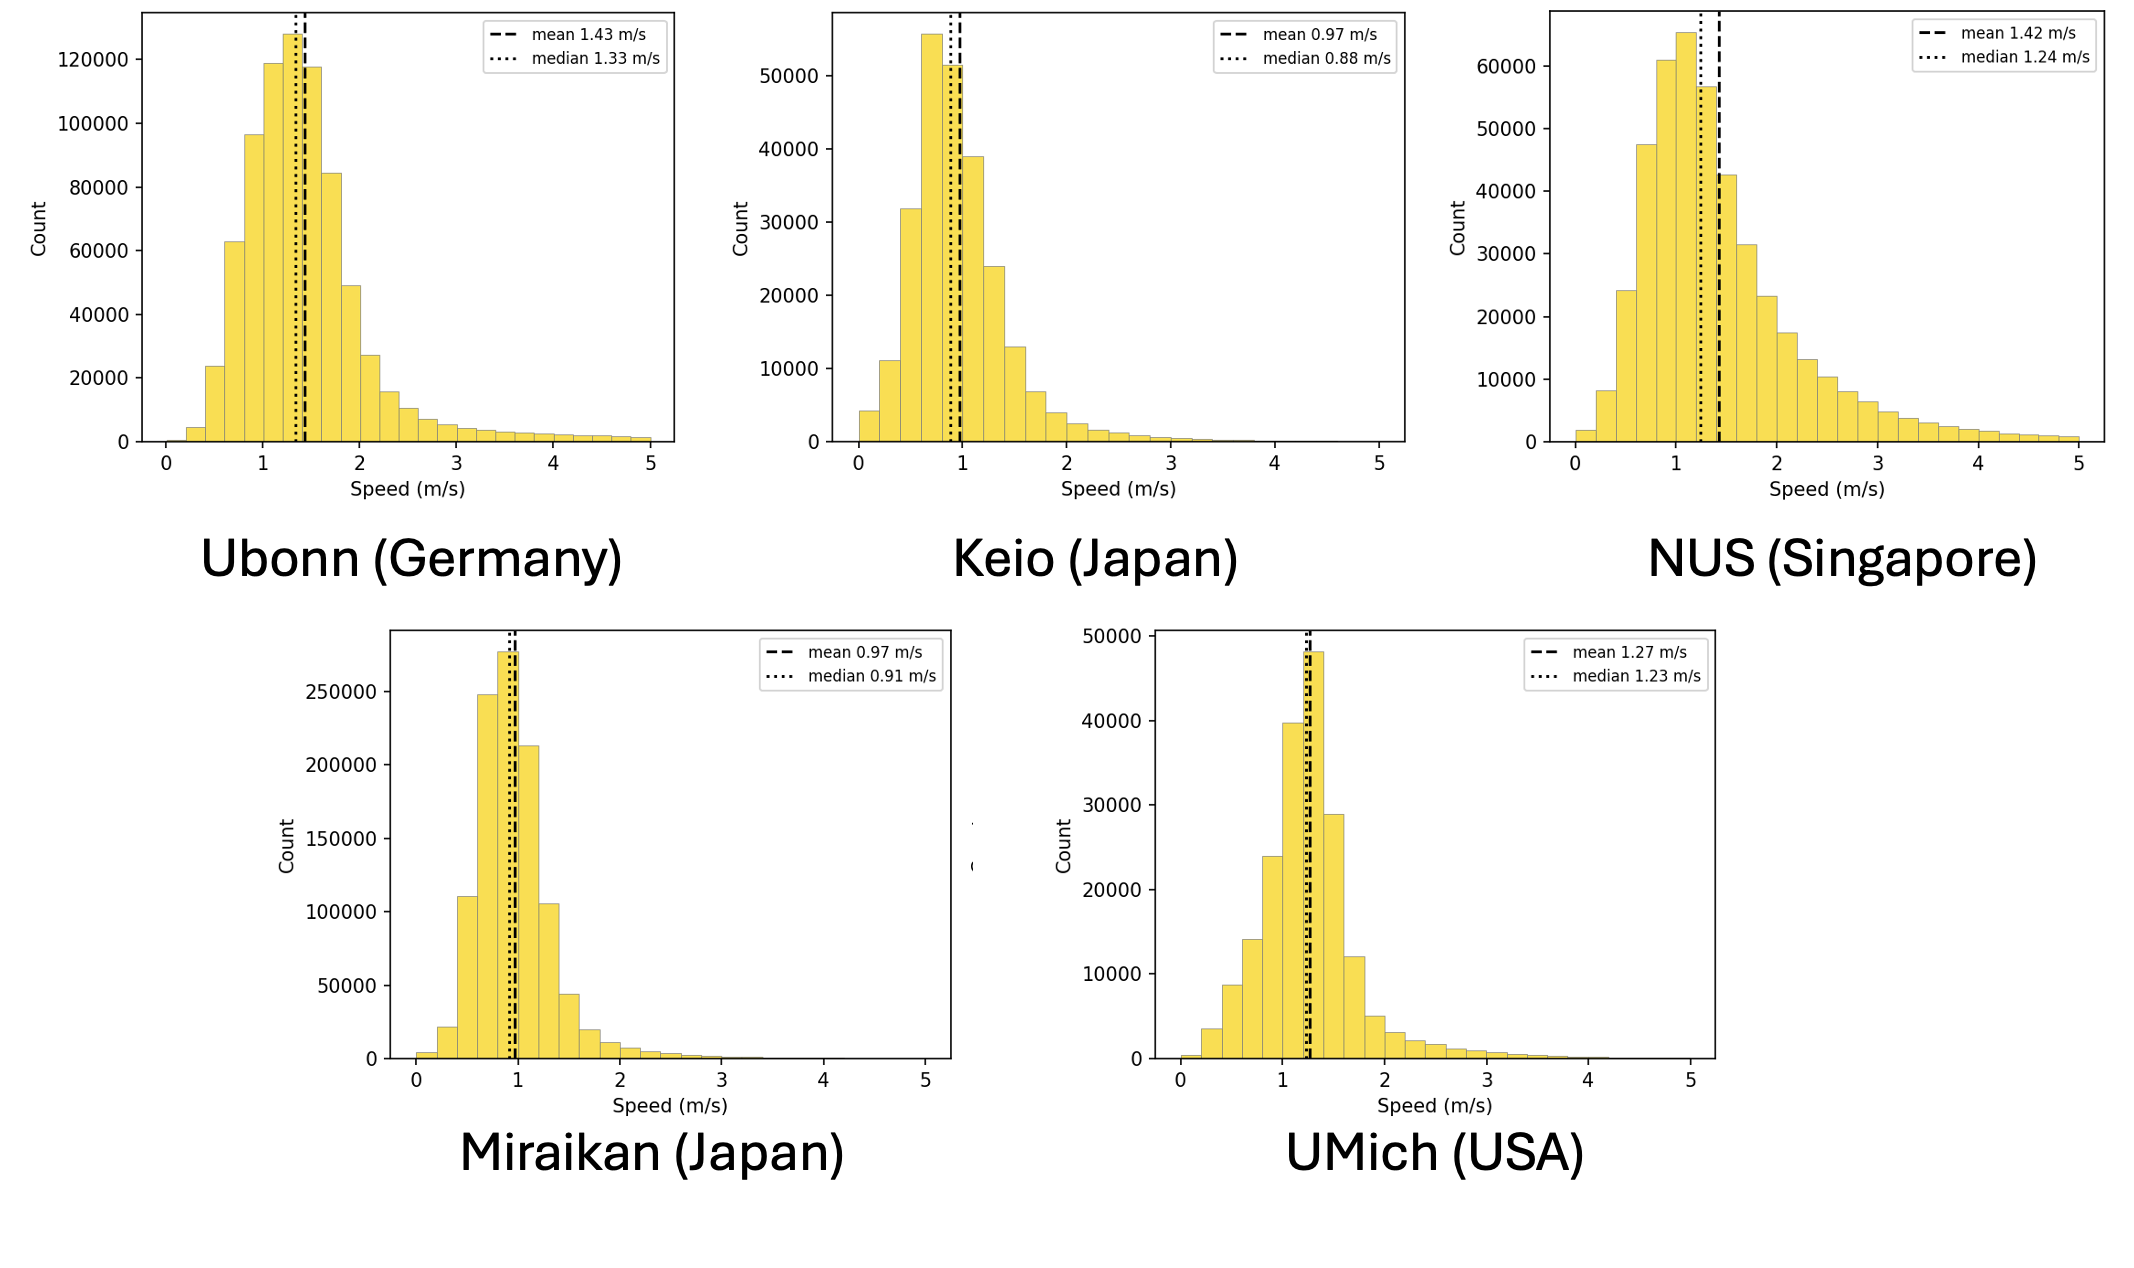
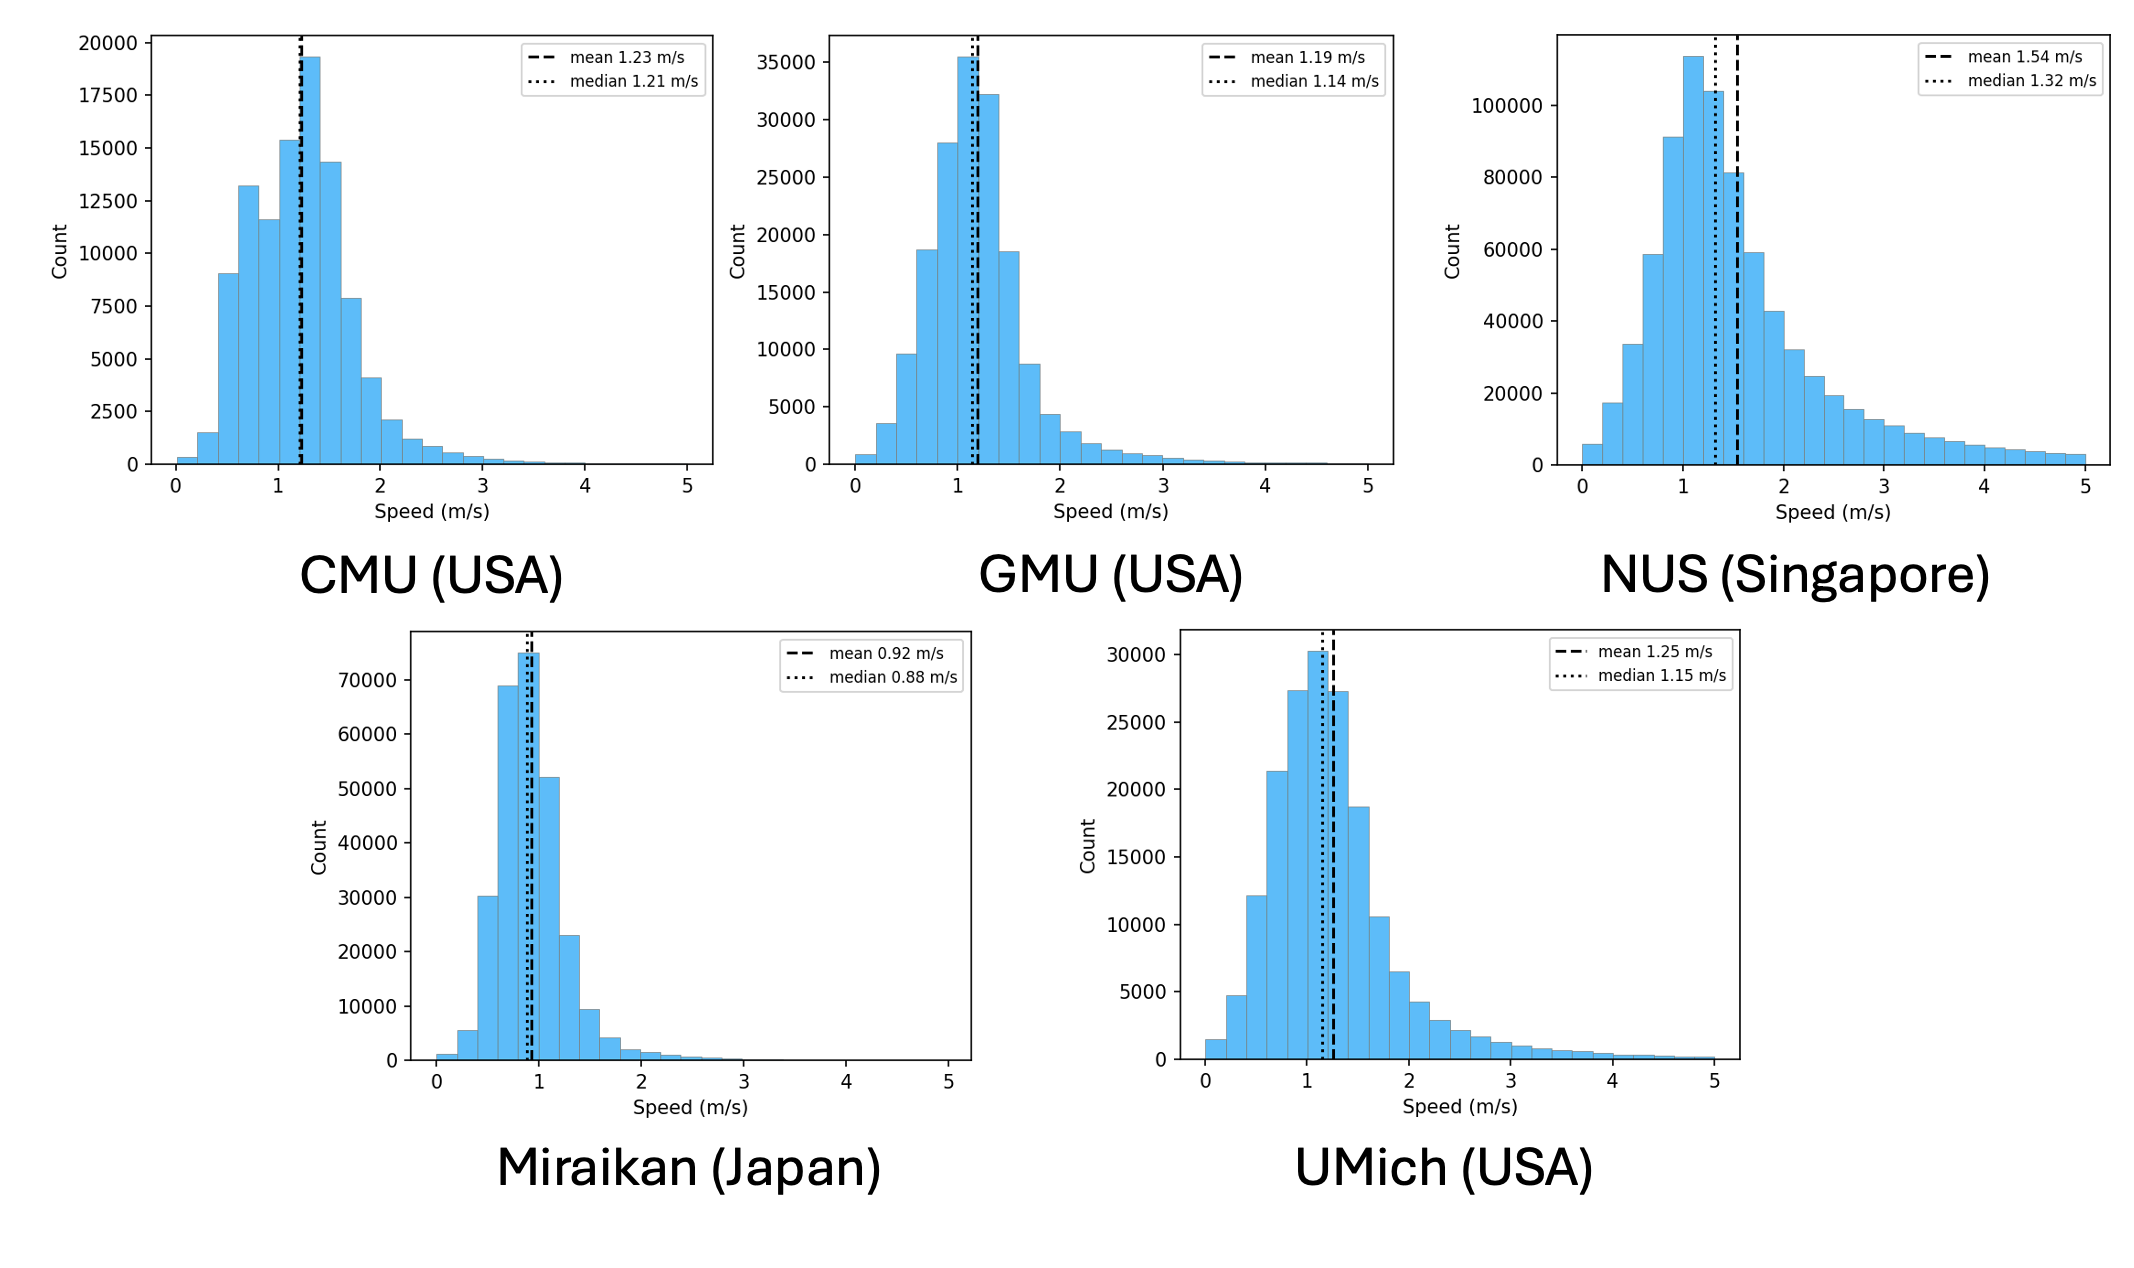
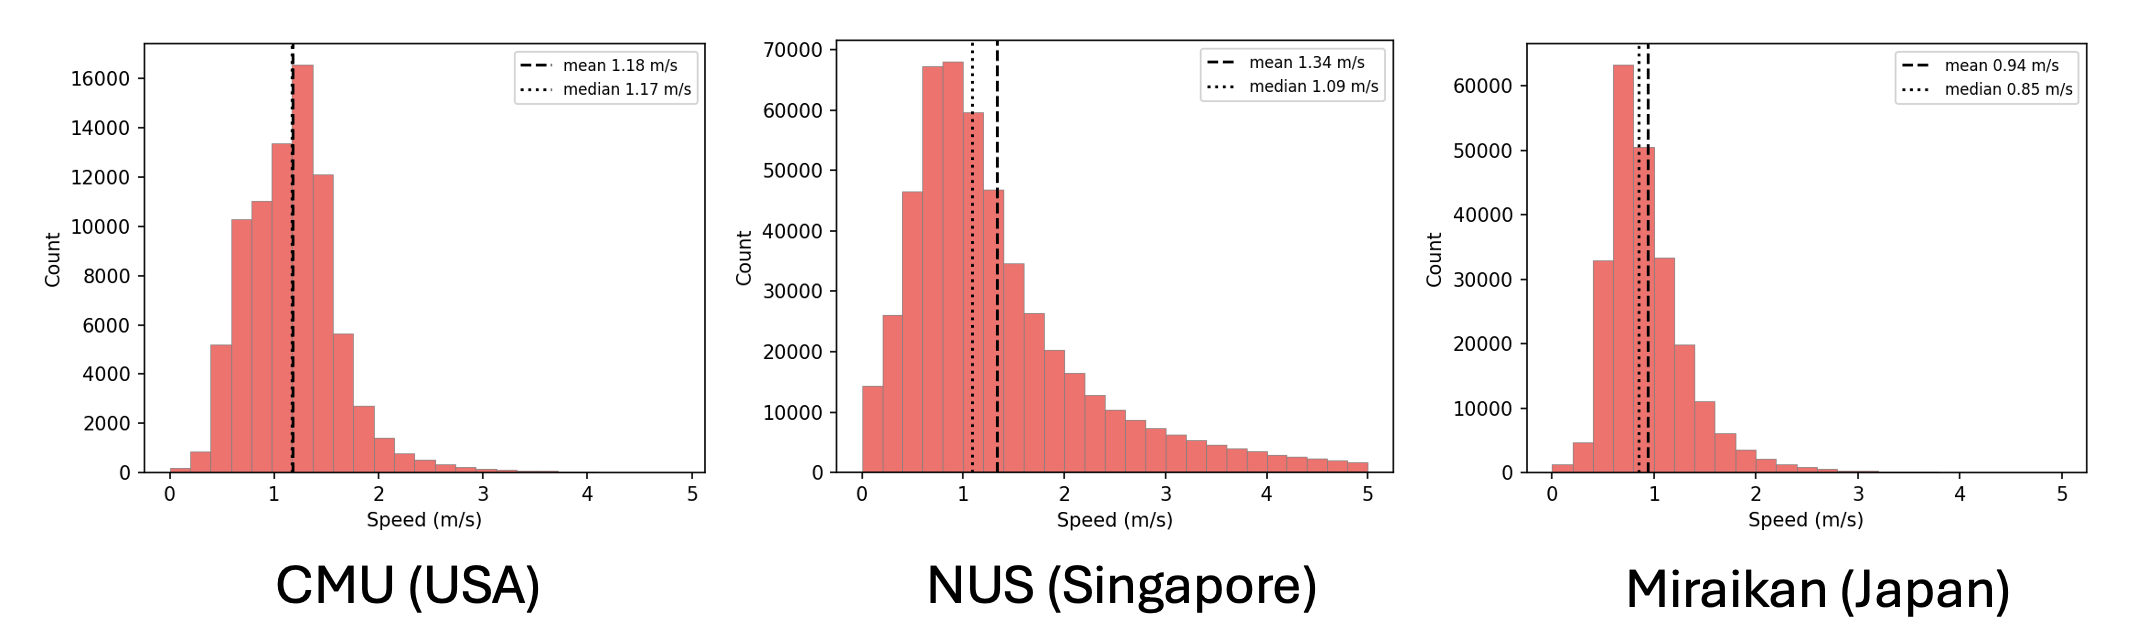
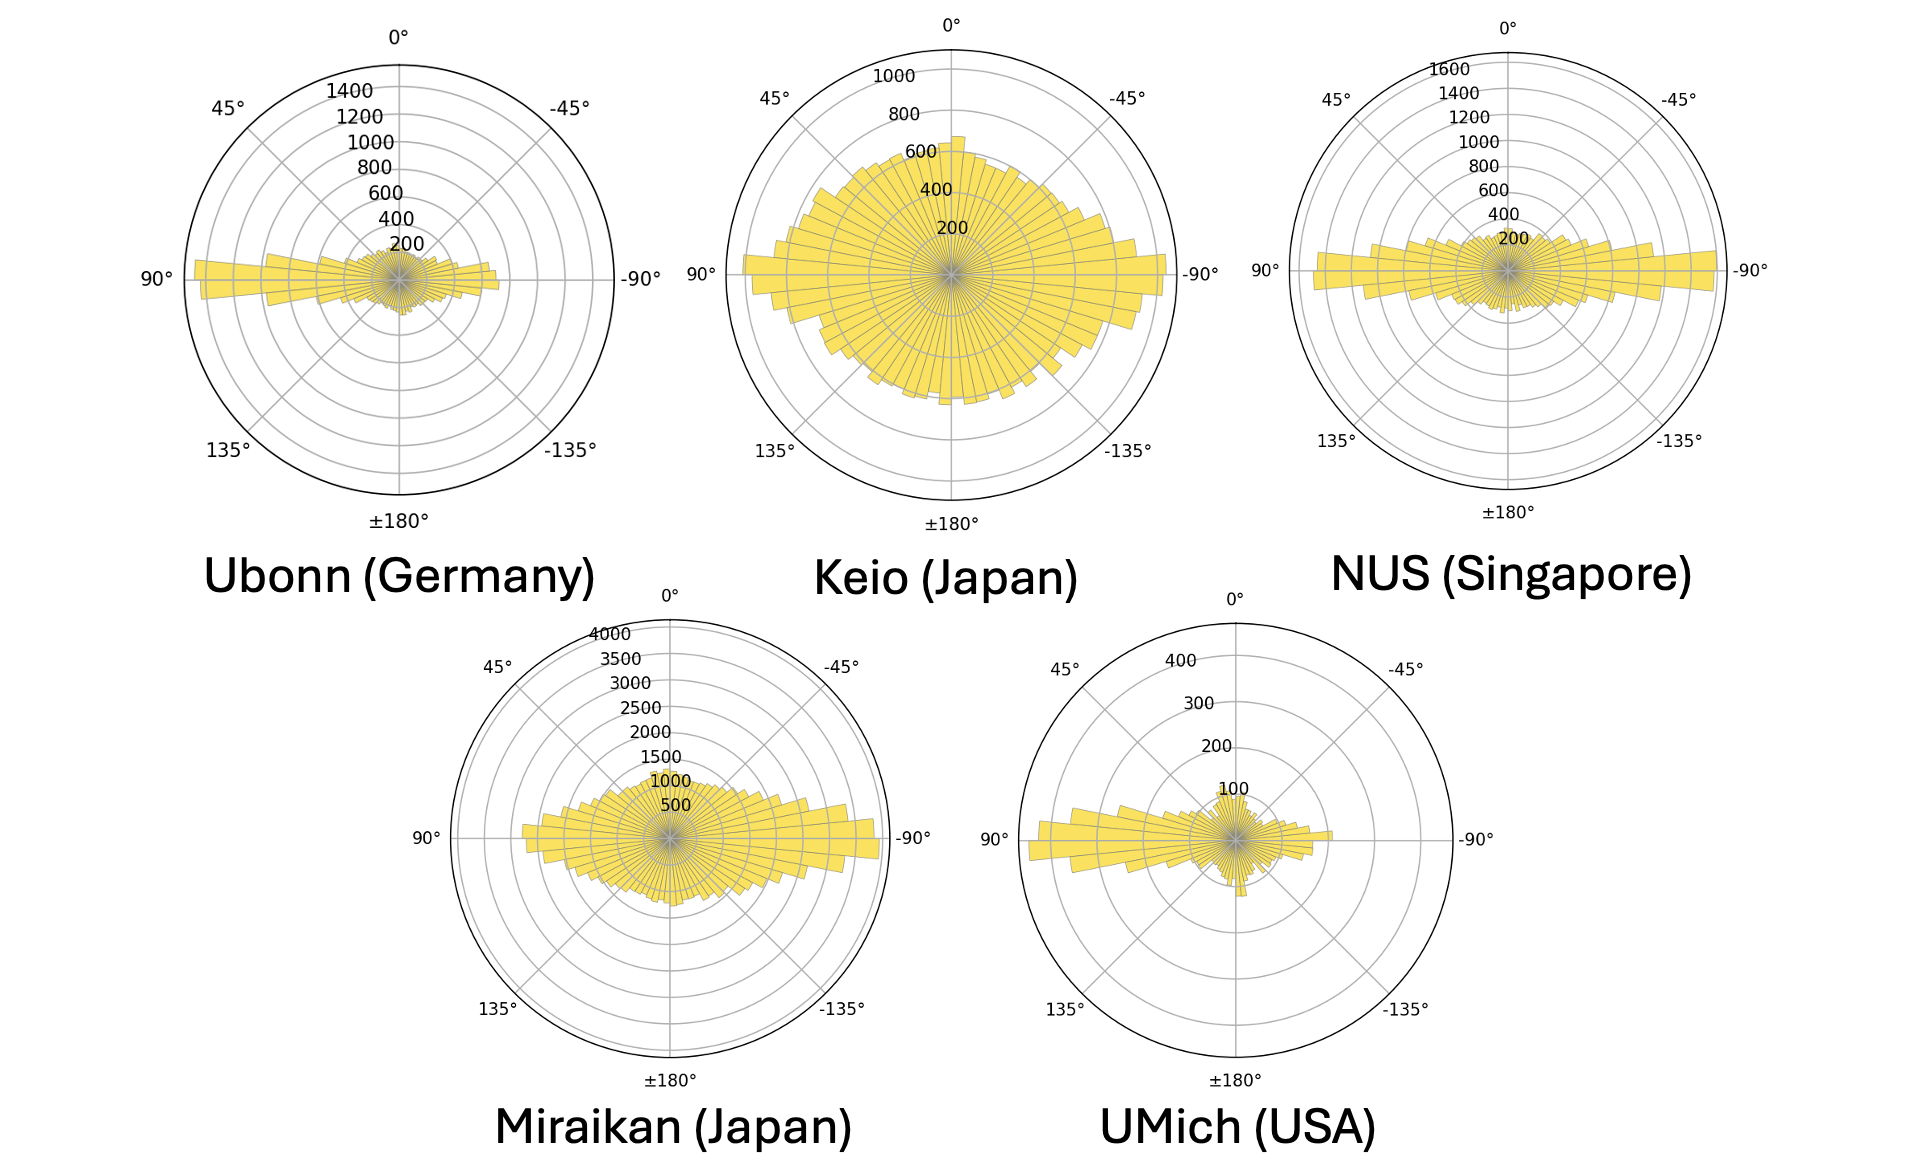
Pedestrian walking speed varies across locations. UBonn (Germany) and NUS (Singapore) show higher average speeds, partly due to outdoor environments. Miraikan (Japan) pedestrians walk slower, consistent with museum browsing behavior. High-density Asian locations (Miraikan, Keio) also show lower speeds.
Cross-Cultural Comparison — Passing Side
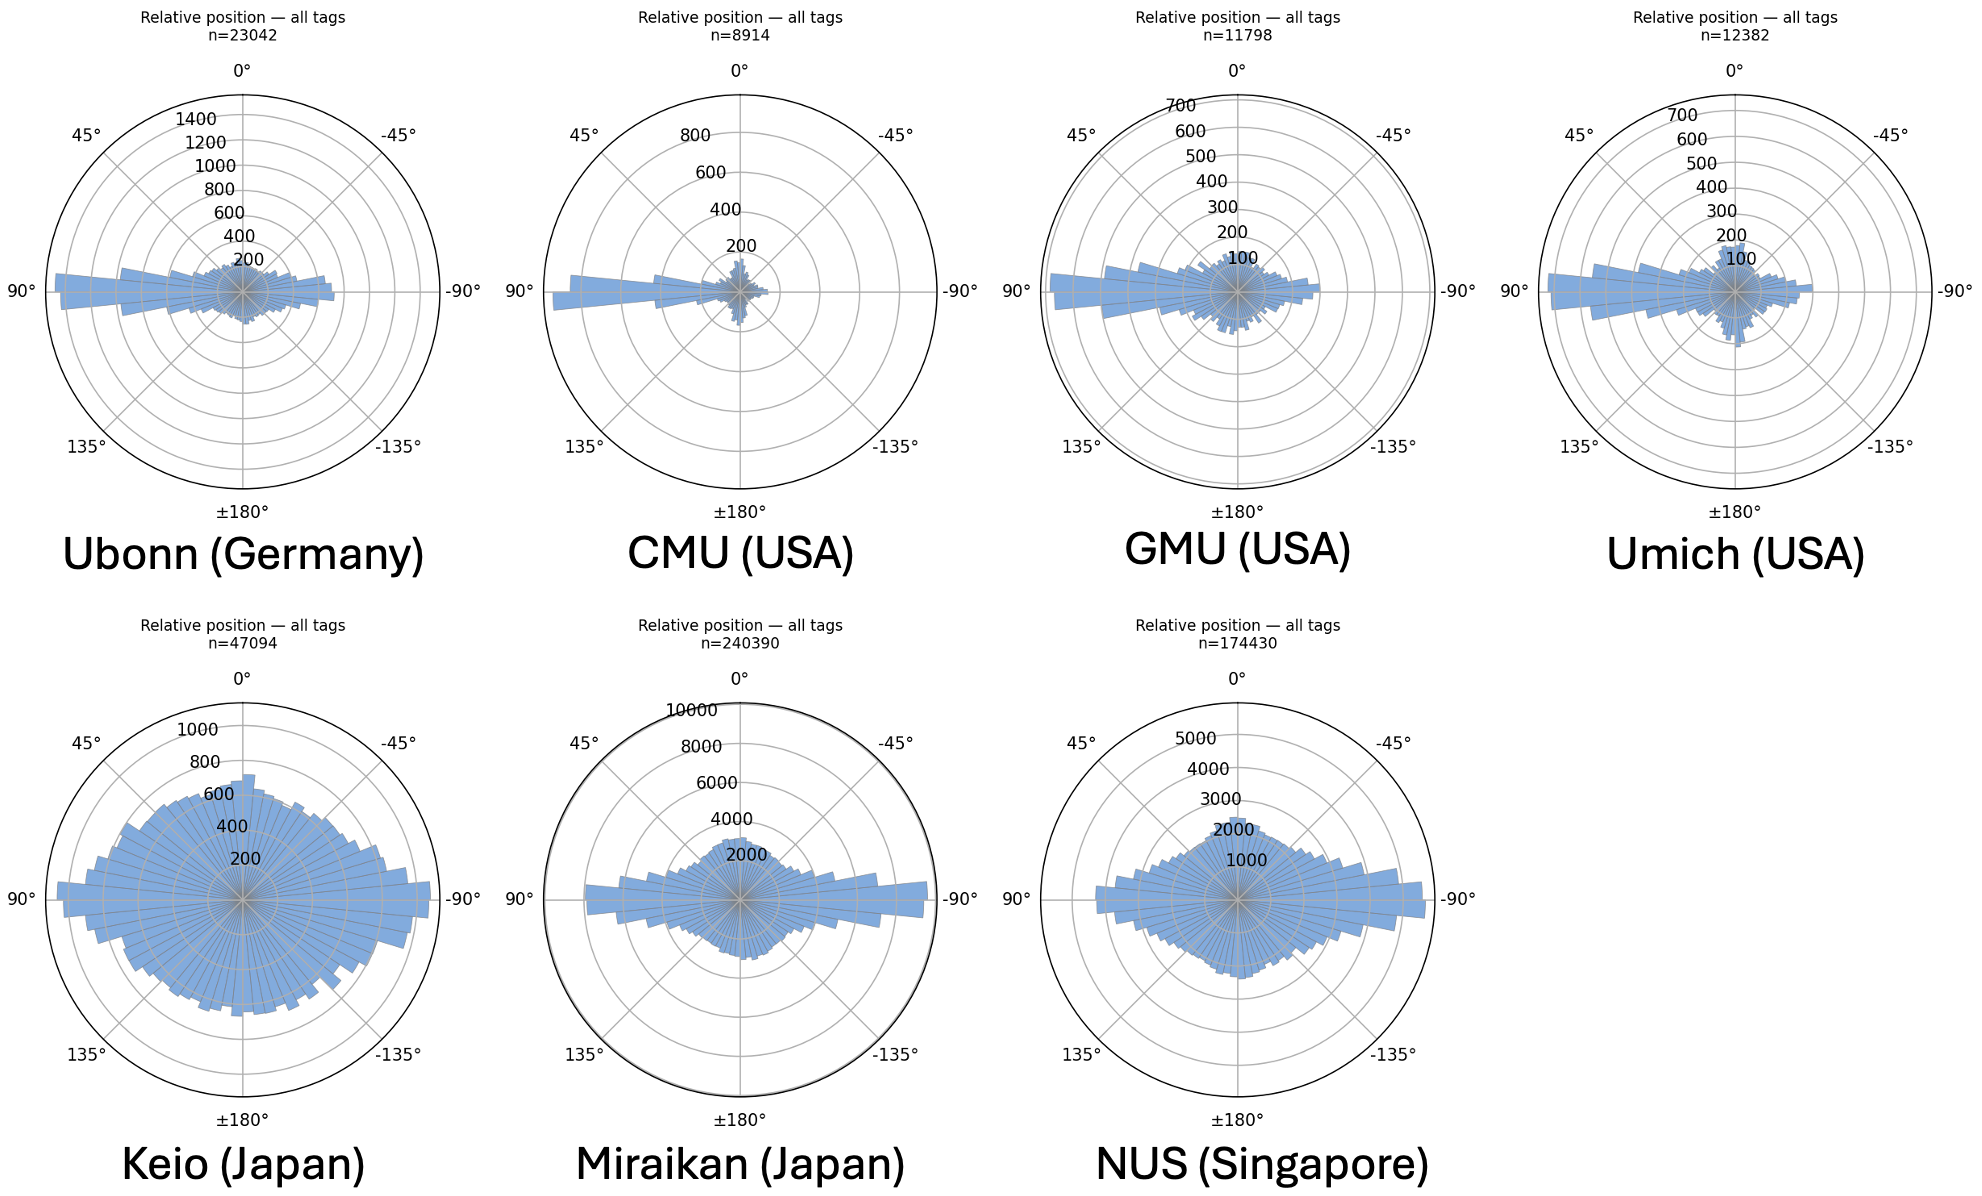
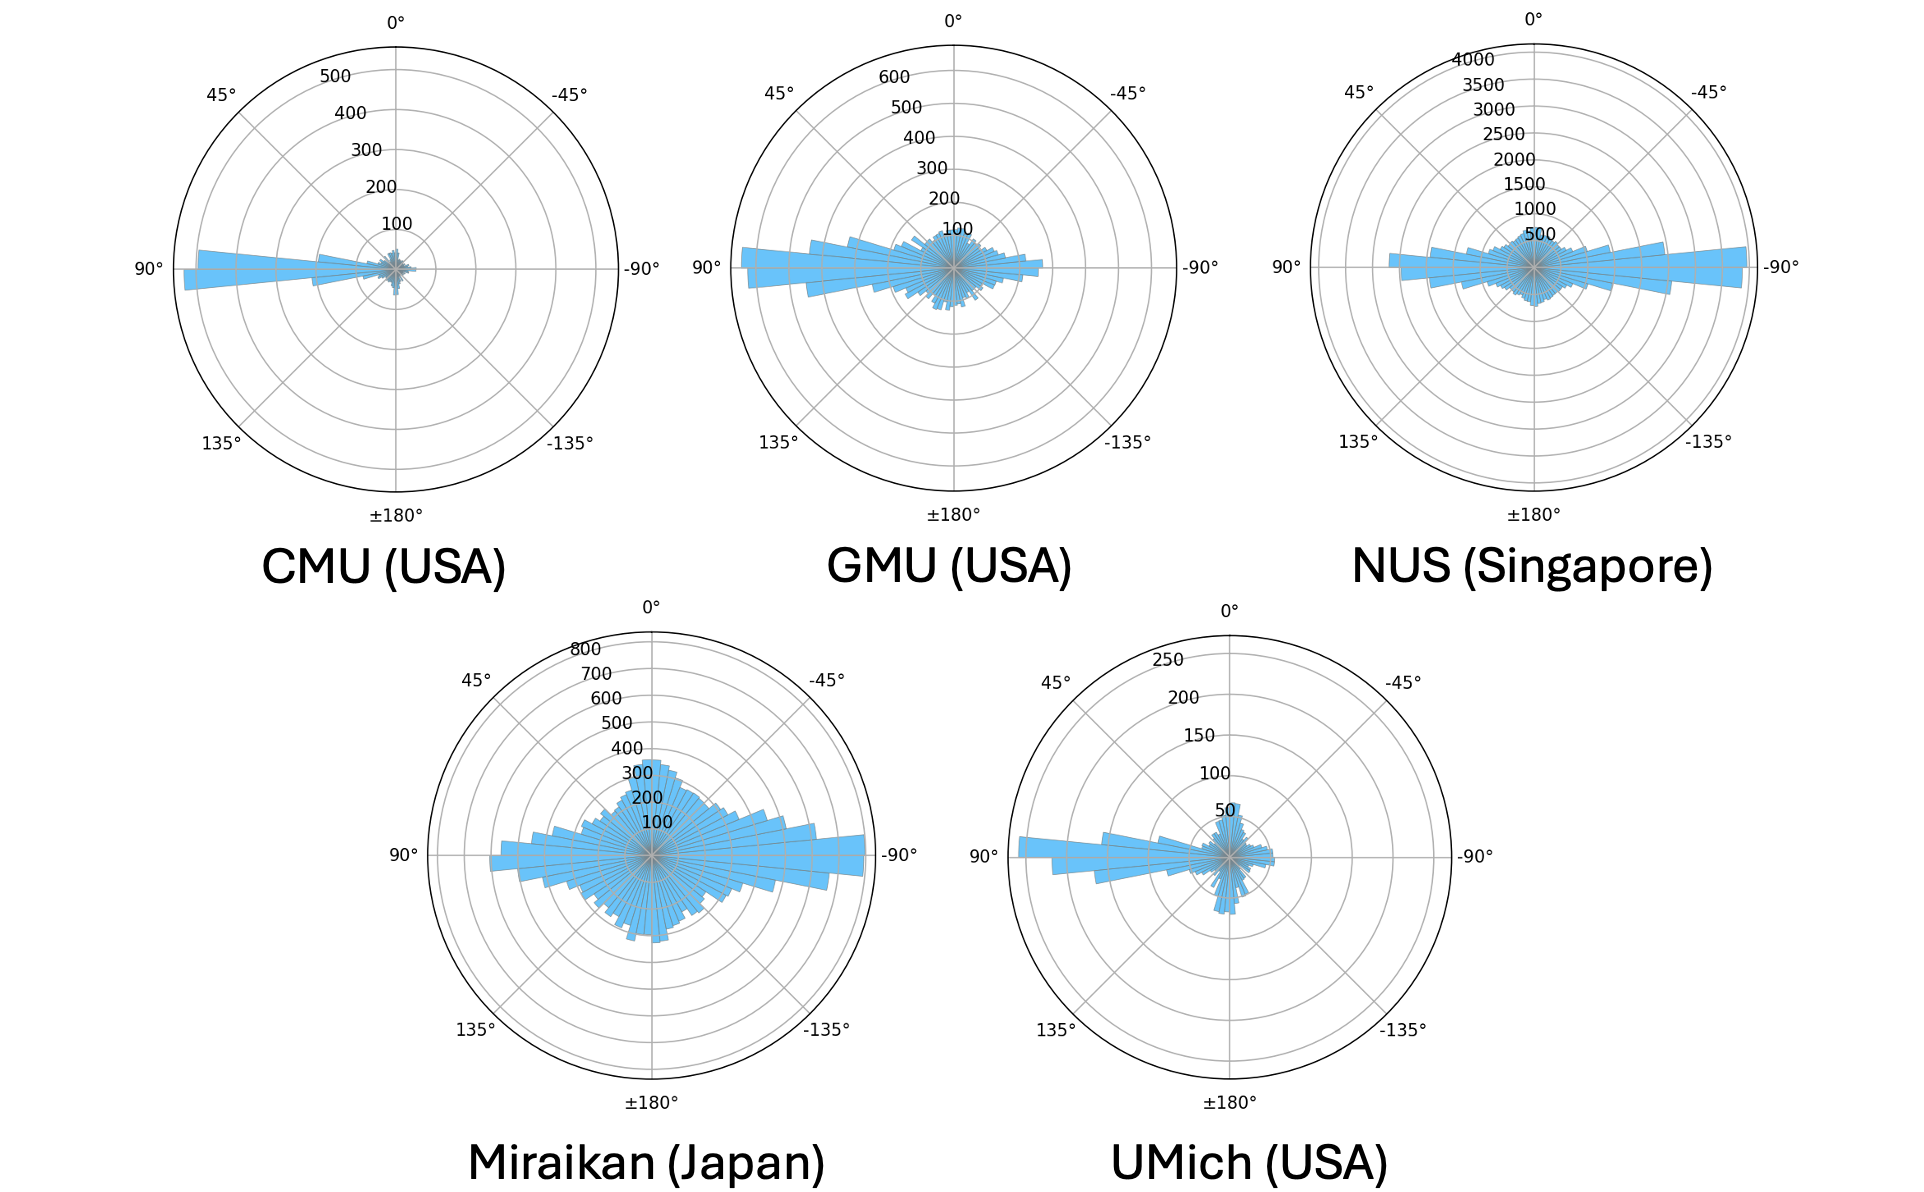
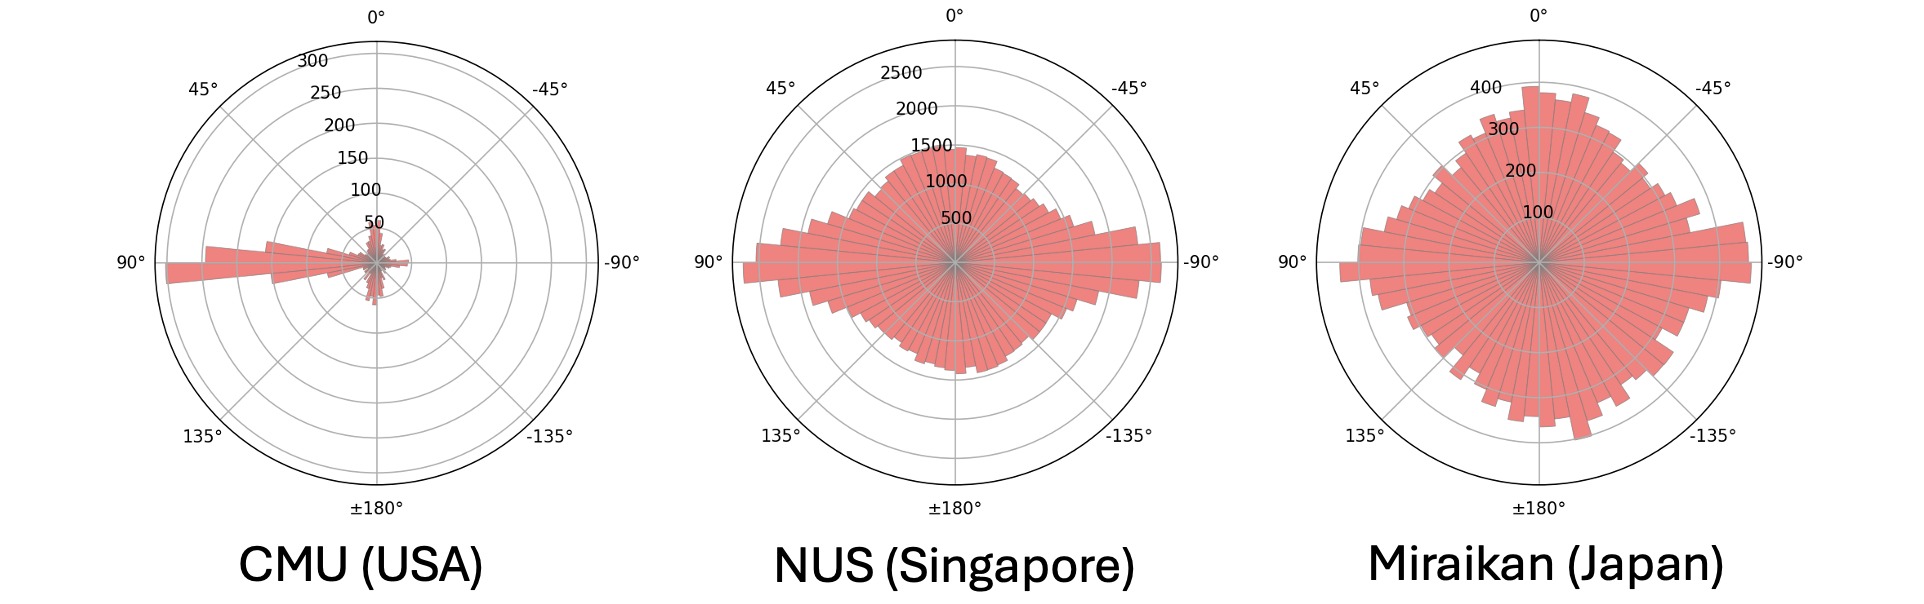
Passing-side preferences correlate with each country's road driving side. US and German institutions (UBonn, UMich, CMU, GMU) show a clear right-side passing tendency. Asian high-density locations (Miraikan, Keio, NUS) show weaker lateral preferences, where lane-following and overtaking interactions dominate over clear passing encounters.
Cross-Cultural Comparison — Personal Space
Personal space (average minimum approach distance) narrows laterally in corridor environments across all cultures, suggesting pedestrians adapt to spatial constraints. Frontal personal space in open areas is surprisingly consistent across countries, while US and Singapore locations show slightly larger frontal personal space in corridor settings (~2.5 m).